Submit an Article
Navigate
Home
Editorial Board
Editorial Policies
Current Volume
Archive
Scientific Integrity
Publication Ethics Statements
Interviews with Outstanding Authors
Newsroom
Sponsored Conferences
Podcast
Contact
Special Collections
Submit an Article
Online ISSN: 1945-4589
Research Paper
|
Volume 15, Issue 12
|
pp. 5887–5916
Swertia cincta
Burkill alleviates LPS/D-GalN-induced acute liver failure by modulating apoptosis and oxidative stress signaling pathways
Back to article
Figure 4
(4 of 12)
−
100%
+
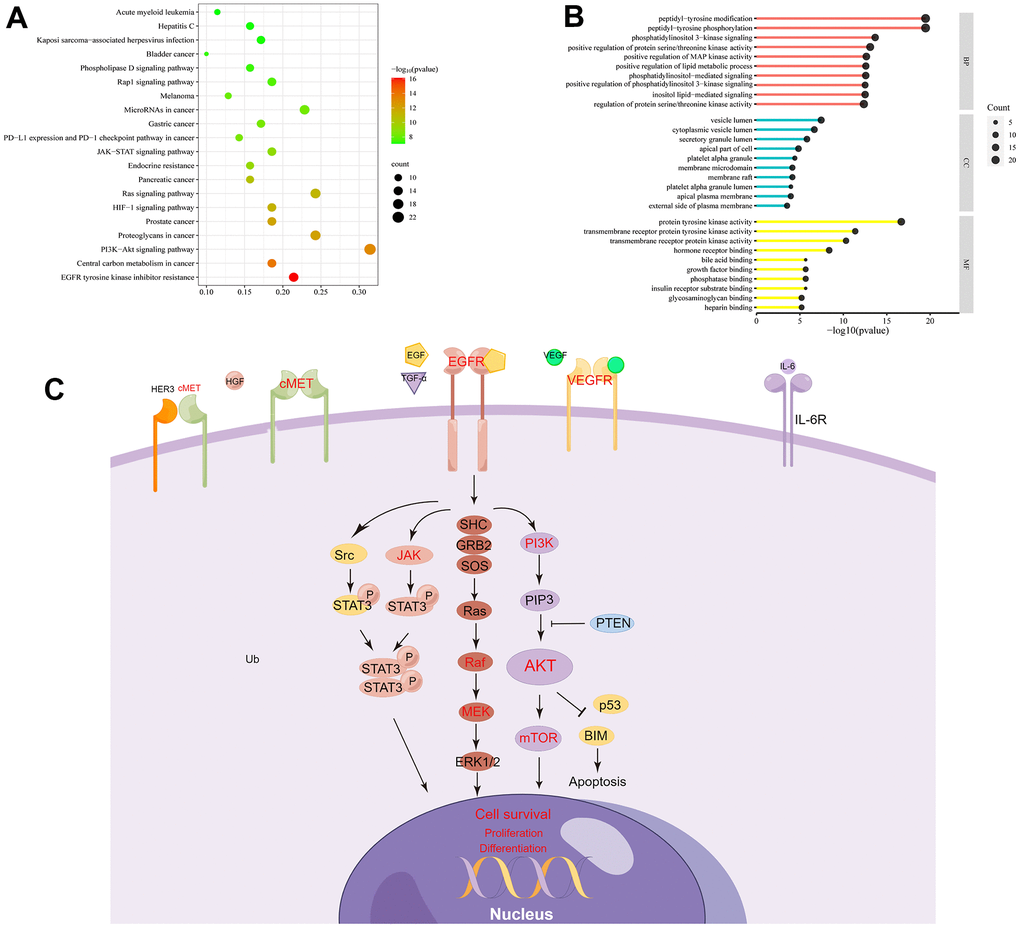
Figure 4.
GO and KEGG enrichment analysis.
(
A
) The top 20 pathways enriched in KEGG. (
B
) GO shows the Top 10 of BP, CC, and MF. (
C
) Genes related to EGFR signaling pathways are represented in a mechanistic diagram.