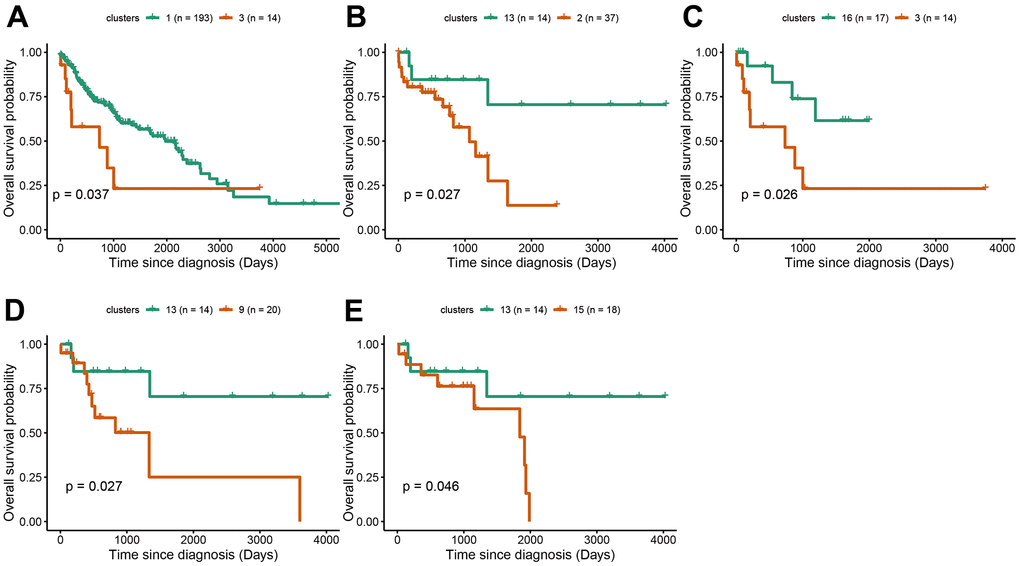
Figure 5.Survival analysis between subgroups of LUSC. (A–E) The survival probabilities between different clusters in LUSC. The statistical analysis was calculated based on log-rank test.
Figure 5 — Identification of prognosis value and immune microenvironment features of ceRNAs in NSCLC with distinct gene mutation | Aging