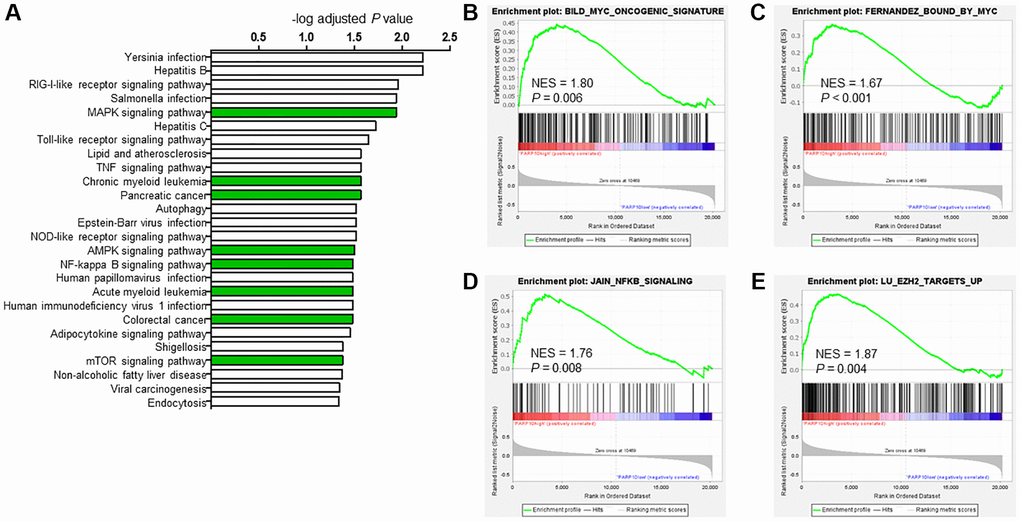
Figure 5.Potential biological functions of PARP10 in AML. (A) KEGG analysis of PARP10 positively co-expressed genes (r > 0.5, P < 0.05). Significantly enriched pathways (adjust P < 0.05) were plotted. And (B–E) GSEA analysis of AML patients based on PARP10 expression. NES: normalized enrichment score.