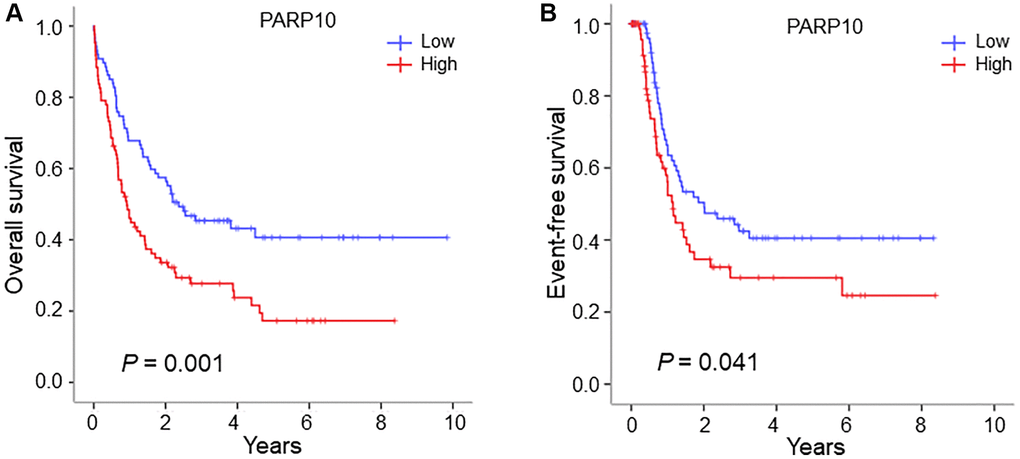
Figure 2.Survival analysis of AML patients with high expression versus low expression in the PARP10 group. (A) Overall survival difference of AML patients with high PARP10 expression versus low PARP10 expression. (B) Event-free survival difference of AML patients with high PARP10 expression versus low PARP10 expression. Log-rank test was used to generate the survival curves and analyze the survival difference between the high- and low-expression groups.