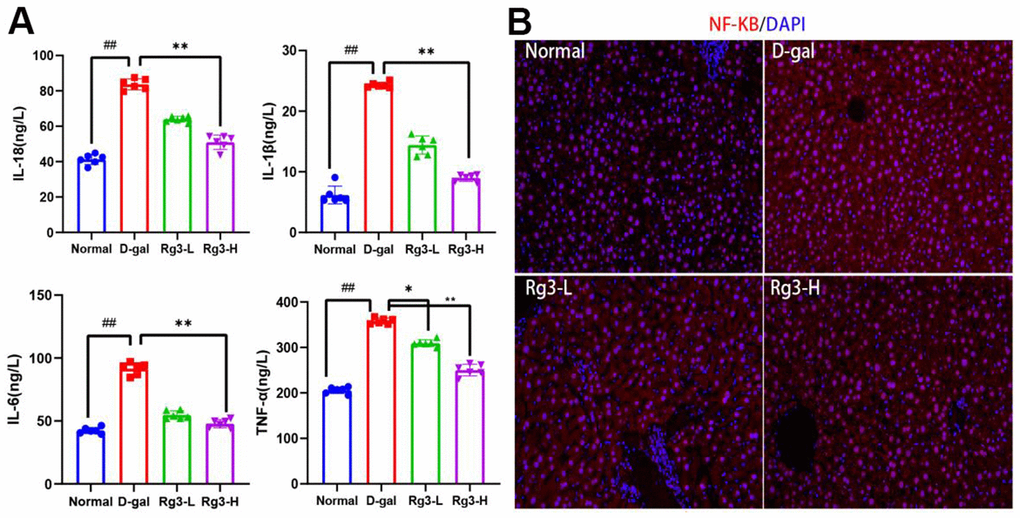
Figure 3.Expression levels of inflammatory related factors induced by Rg3 on D-gal in mice. (A) Serum inflammatory cytokines in mice. (B) Immunofluorescence section of NF-KB in mouse liver. Results are represented by mean±S.D. #p<0.05, ##p<0.01 vs. Normal group. *p<0.05, **p<0.01 vs. D-gal group.