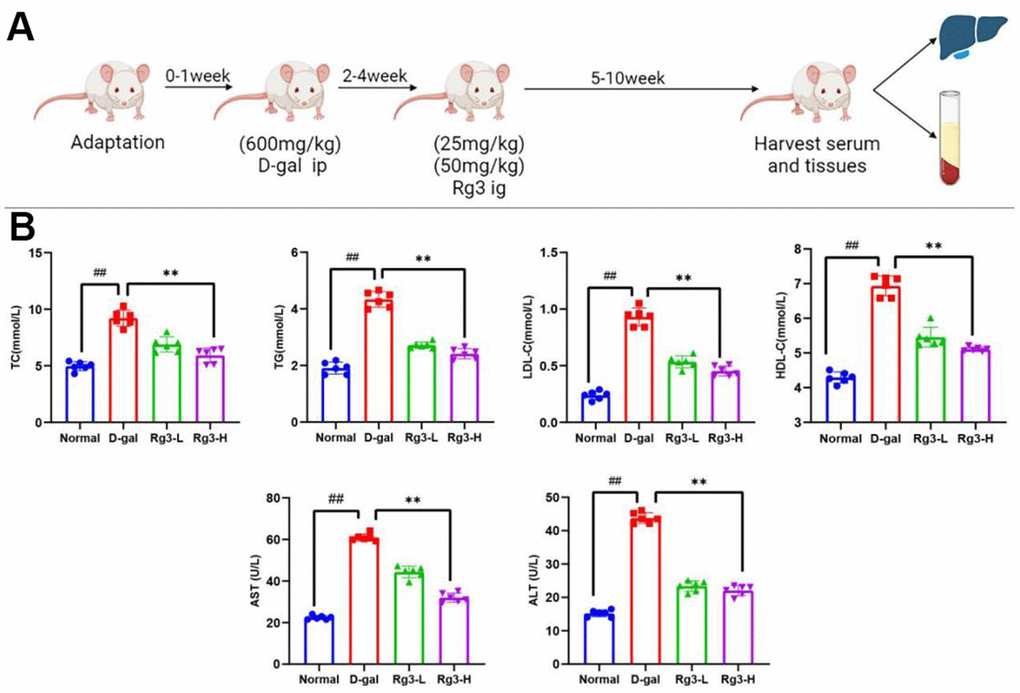
Figure 1.(A) Sketch map showing D-galactose mediated mouse aging and damage models. (B) Serum lipid metabolism and liver function indexes in mice. Results are represented by mean±S.D. #p< 0.05, ##p<0.01 vs. Normal group. *p<0.05, **p<0.01 vs. D-gal group.