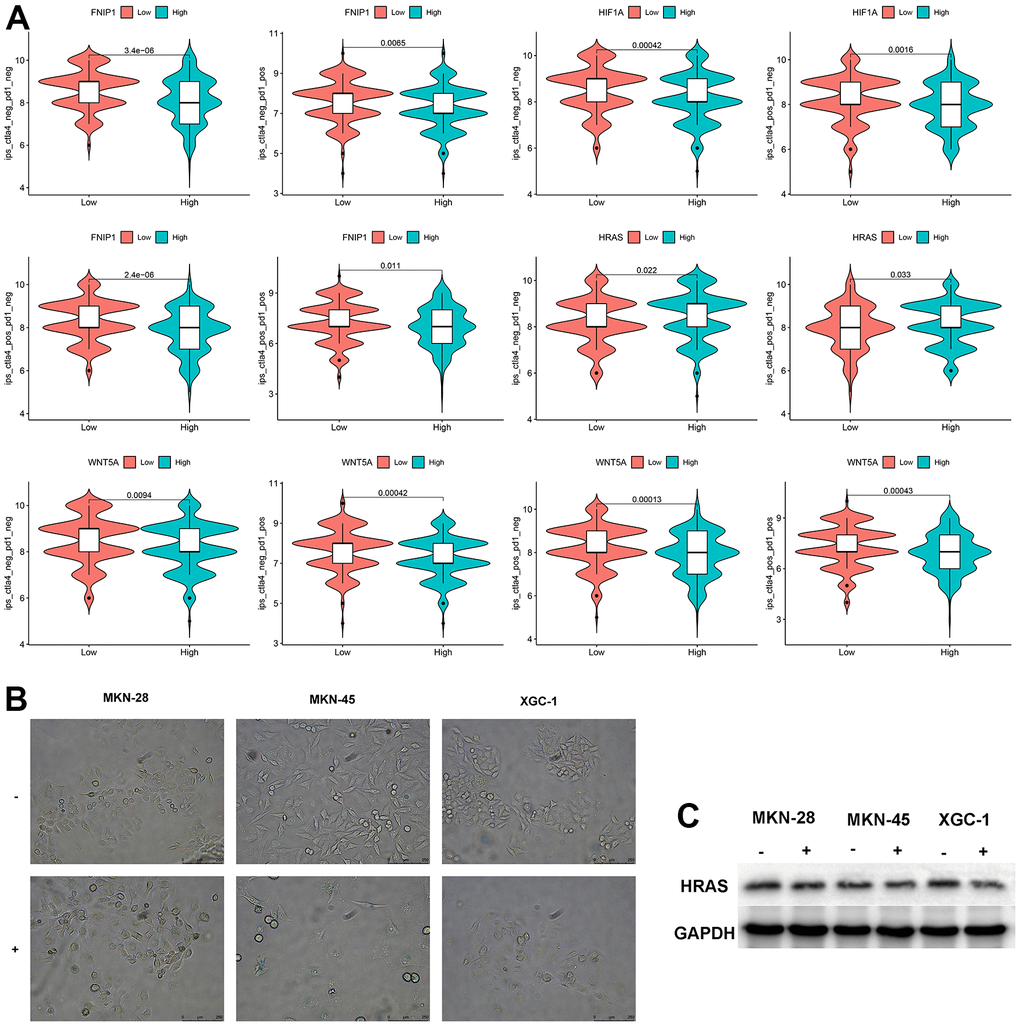
Figure 4.Analysis of feature genes. (A) The impact of characteristic genes on immunotherapy. (B) Bleomycin-induced cellular senescence (bar=250μm) (“-“represents the control group, “+” represents bleomycin induction). (C) Changes in HRAS expression levels after cellular senescence.