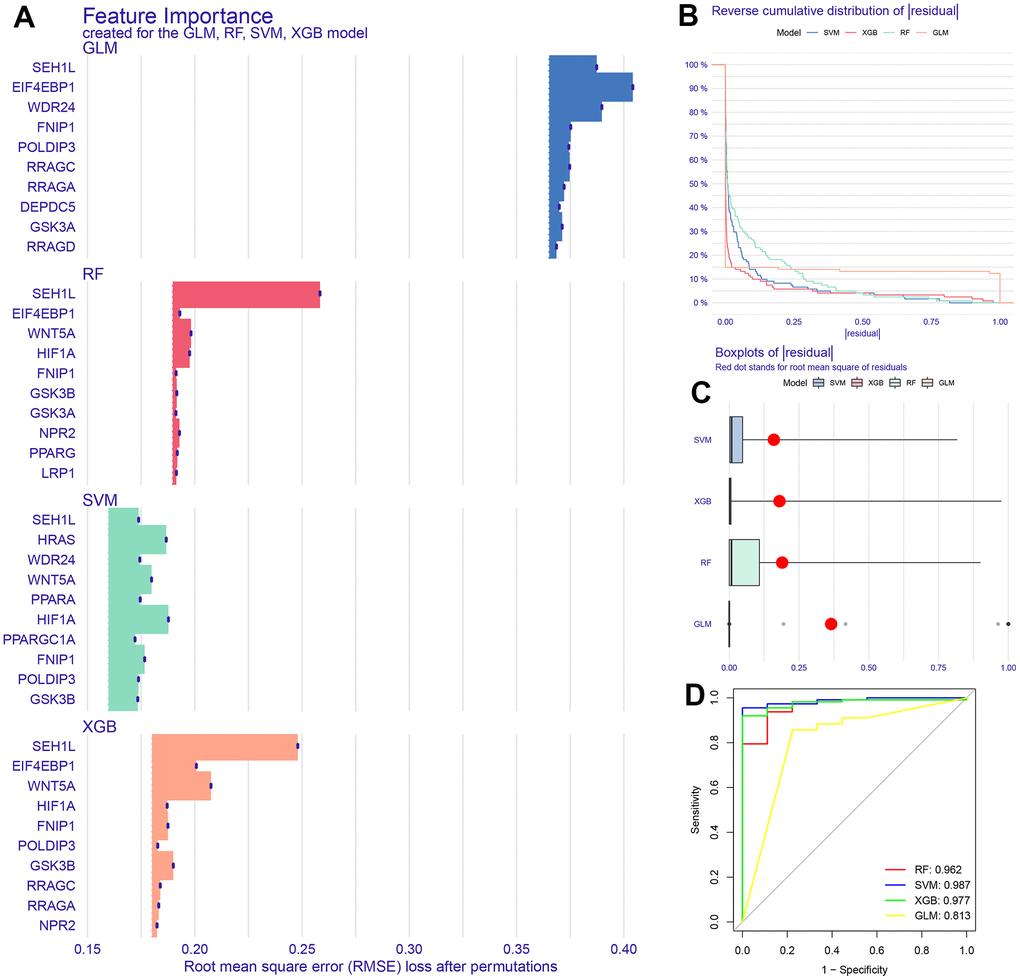
Figure 1.Construction of machine learning model. (A) Top 10 characteristic genes in 4 models. (B, C) Boxplots of residual and reverse cumulative distribution of residual. (D) The area under ROC curve of 4 models.
Figure 1 — Machine learning models predict the mTOR signal pathway-related signature in the gastric cancer involving 2063 samples of 7 centers | Aging