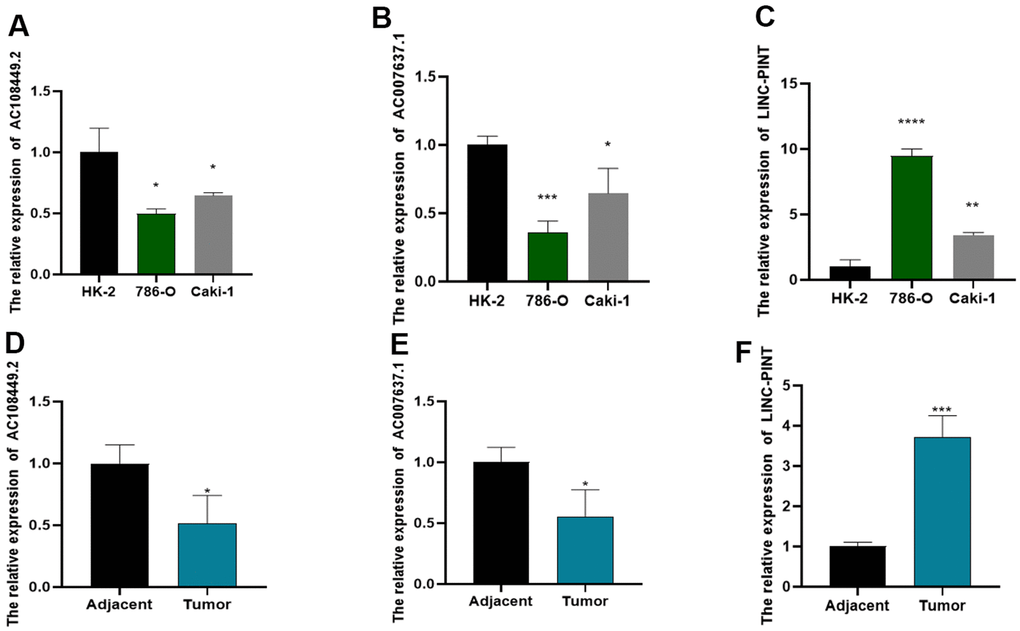
Figure 8.The expression levels of LINC-PINT, AC108449.2 and AC007637.1 in cell lines and ccRCC clinical samples. AC108449.2 (A) and AC007637.1 (B) expressed higher in HK-2 cell than that in ccRCC cell lines. The expression of LINC-PINT enhanced in ccRCC cell lines (C). The expression of AC108449.2 (D) and AC007637.1 (E) were increased in normal kidney tissues, while LINC-PINT (F) was up-regulated in ccRCC tissues.