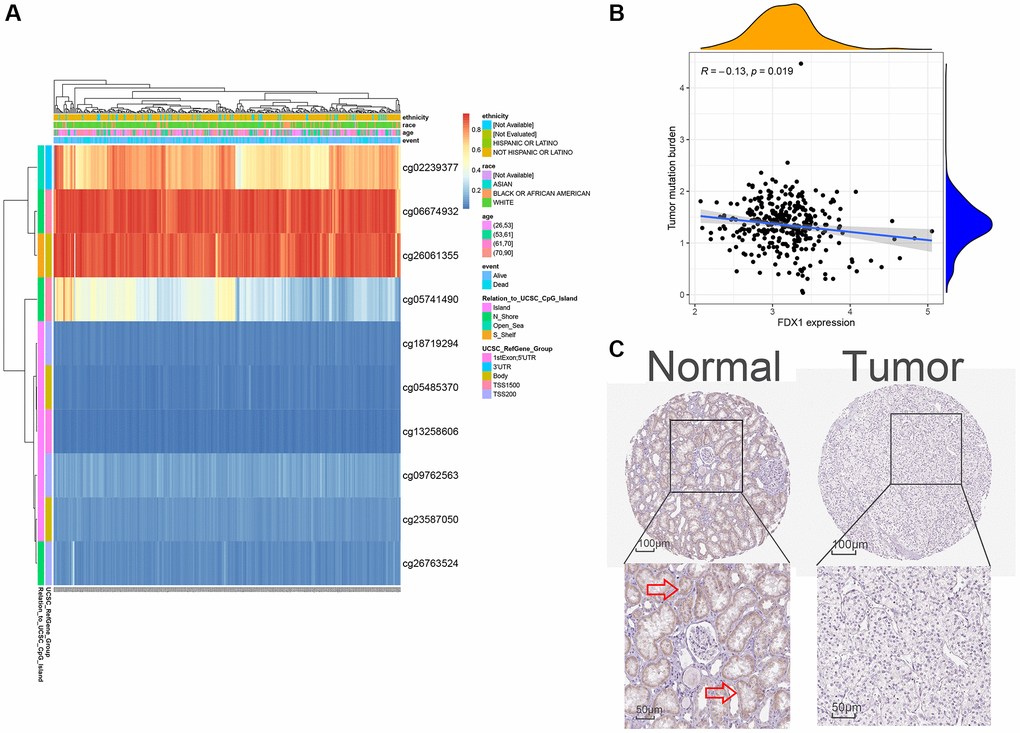
Figure 8.Methylation, protein levels, and tumor mutational burden of FDX1. (A) The heat map of DNA methylation of FDX1. (B) The tumor mutation burden of FDX1. (C) FDX1 protein levels based on HPA. The red arrow in C marks the site of FDX1 staining.
Figure 8 — Confirmation of the predictive function of cuproptosis-related gene FDX1 in clear cell renal carcinoma using qRT-PCR and western blotting | Aging