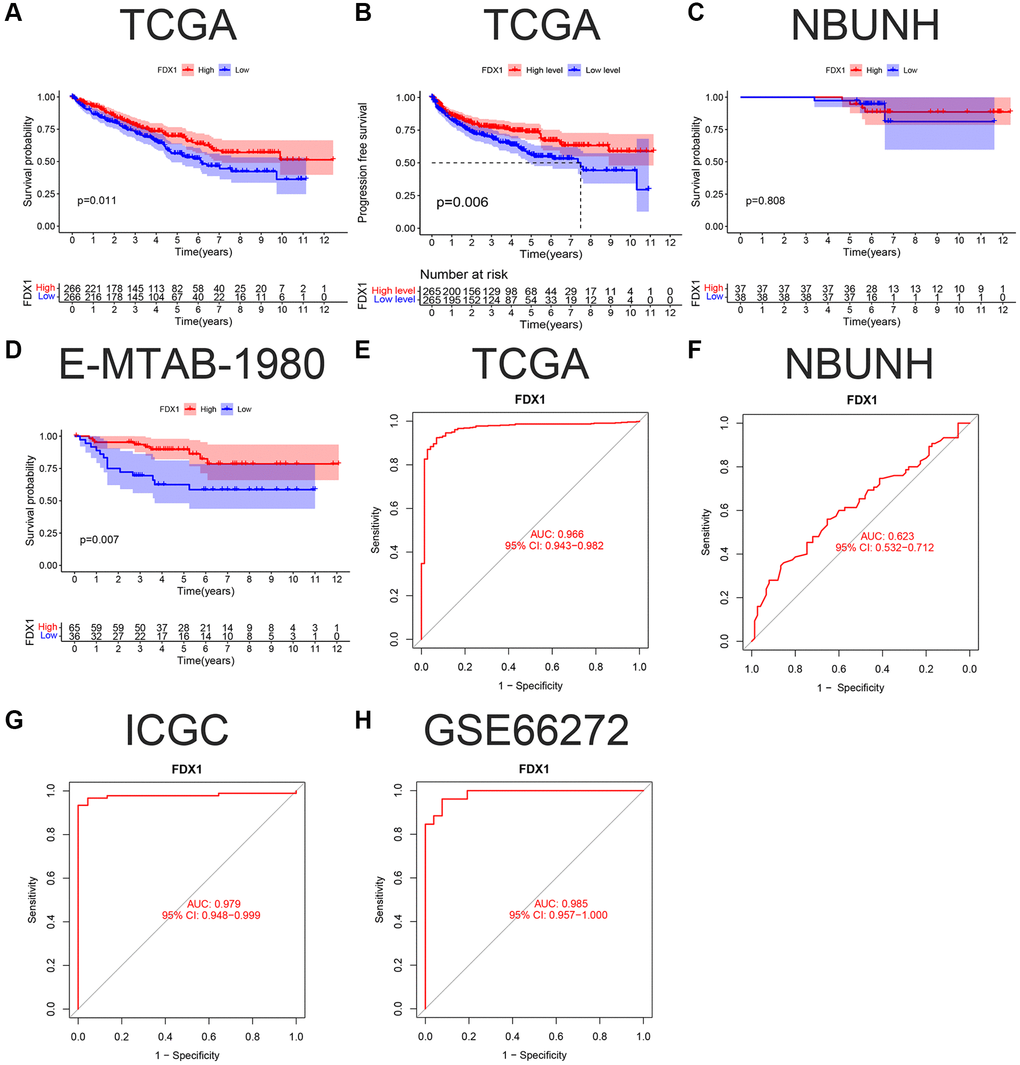
Figure 4.K-M survival curve and ROC of FDX1 in ccRCC. (A, B) OS (Overall survival) and DFS (Disease-free survival) in TCGA cohort. (C, D) OS in the NBUNH and E-MTAB-1980 cohorts. (E–H) ROC curves of TCGA, NBUNH, ICGC, and GSE66272 cohorts.
Figure 4 — Confirmation of the predictive function of cuproptosis-related gene FDX1 in clear cell renal carcinoma using qRT-PCR and western blotting | Aging