Submit an Article
Navigate
Home
Editorial Board
Editorial Policies
Current Volume
Archive
Scientific Integrity
Publication Ethics Statements
Interviews with Outstanding Authors
Newsroom
Sponsored Conferences
Podcast
Contact
Special Collections
Submit an Article
Online ISSN: 1945-4589
Research Paper
|
Volume 15, Issue 12
|
pp. 5482–5496
Dissecting the alternation landscape of mitochondrial metabolism-related genes in lung adenocarcinoma and their latent mechanisms
Back to article
Figure 8
(8 of 9)
−
100%
+
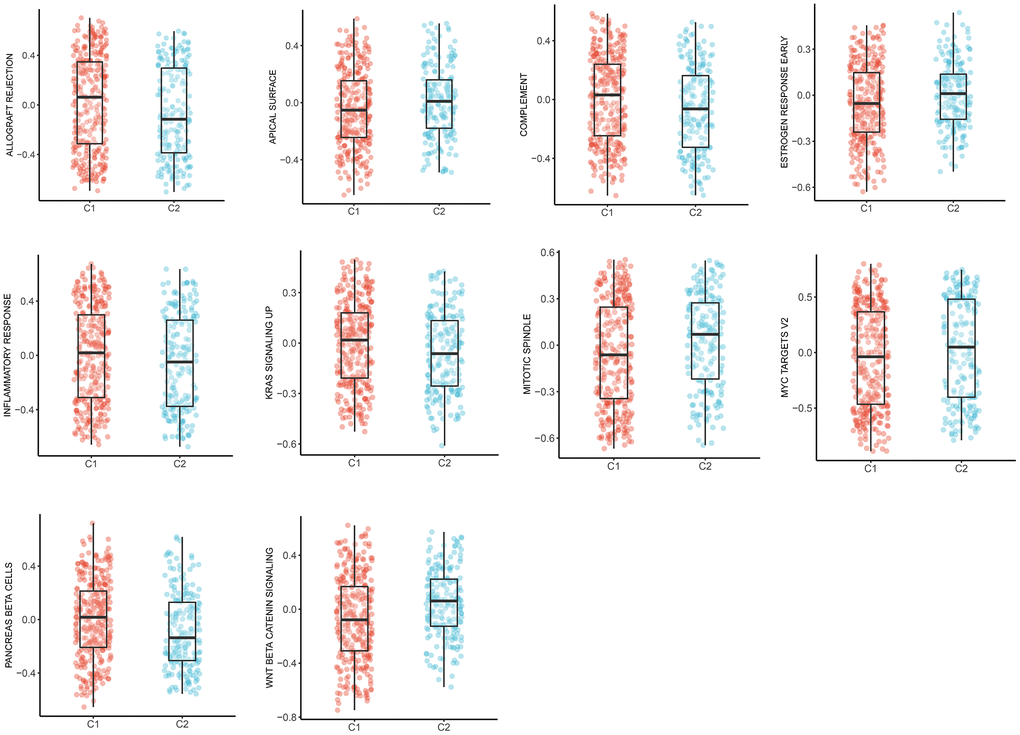
Figure 8.
The box plots of 10 tumor-specific pathways in C1 and C2.
Figure 8 — Dissecting the alternation landscape of mitochondrial metabolism-related genes in lung adenocarcinoma and their latent mechanisms | Aging