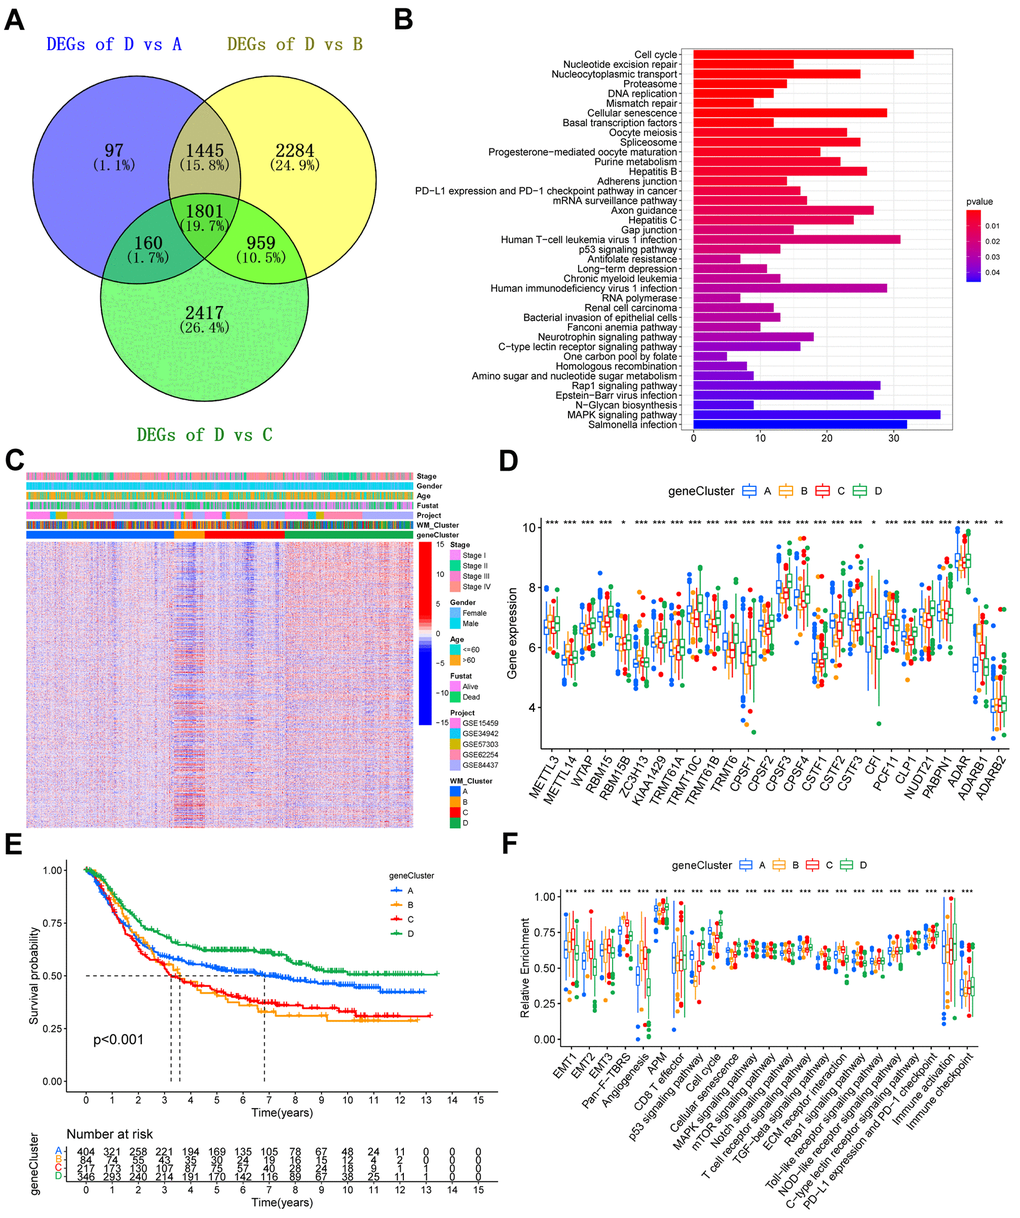
Figure 4.Construction of gene signatures and functional annotation. (A) Venn diagram showing the 1801 overlapped DEGs between WM_Cluster D and the other three clusters. (B) KEGG enrichment analysis of the overlapped 1801 RNA modification patterns. The length of the bars represents the number of genes enriched. (C) Unsupervised clustering of overlapping RNA modification-related genes in the meta-GEO cohort to classify patients into different genomic subtypes, defined as gene clusters A-D, respectively. Gene clusters, WM_Clusters, GC cohort names, tumor stage, survival status, age, and gender were used as patient annotations. (D) Kaplan–Meier curve showing the overall survival status of the four gene clusters based on the meta-GEO cohort. Gene cluster A, blue; gene cluster B, orange; gene cluster C, red; gene cluster D, green. The grouping status of the patients is indicated at the bottom of the chart. P < 0.05 in the Log-rank test was considered statistically significant. (E) Expression levels of the 26 writers in the four gene clusters. (F) Relative enrichment of some stromal-related, immune-related, and tumor-related pathways of the four gene clusters. For (E) and (F), the upper and lower ends of the boxes represent interquartile ranges of values. Lines in the boxes represent the median value. The four colors of the dots are outliers. Asterisks above the boxes represent the statistical p-value (*P < 0.05; **P < 0.01; ***P < 0.001).