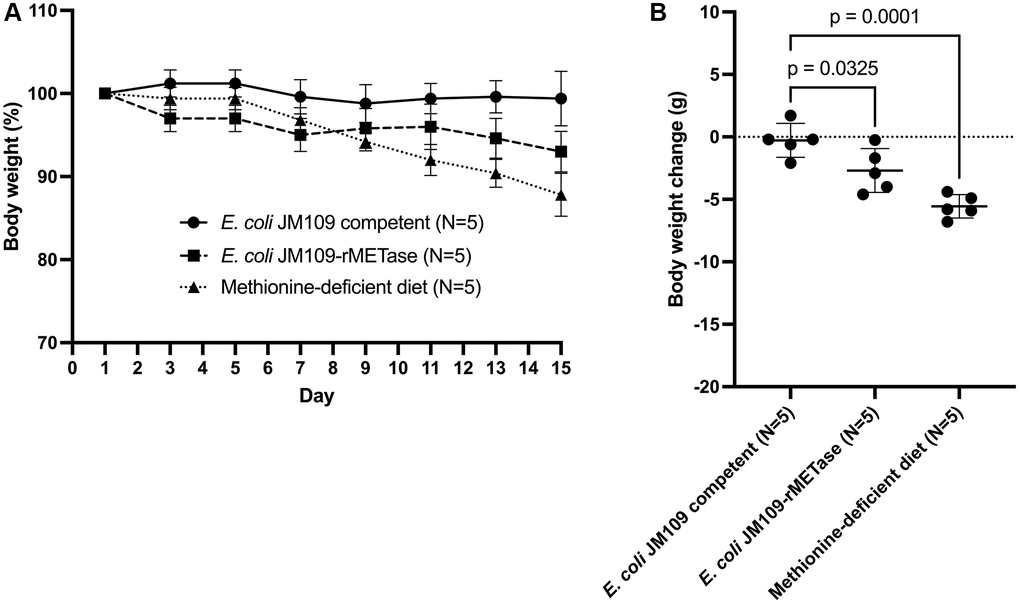
Figure 2.(A) Percent body weight change from study days 1–15. (B) Body weight change from baseline in each group on day 15.
Figure 2 — Old-age-induced obesity reversed by a methionine-deficient diet or oral administration of recombinant methioninase-producing Escherichia coli in C57BL/6 mice | Aging