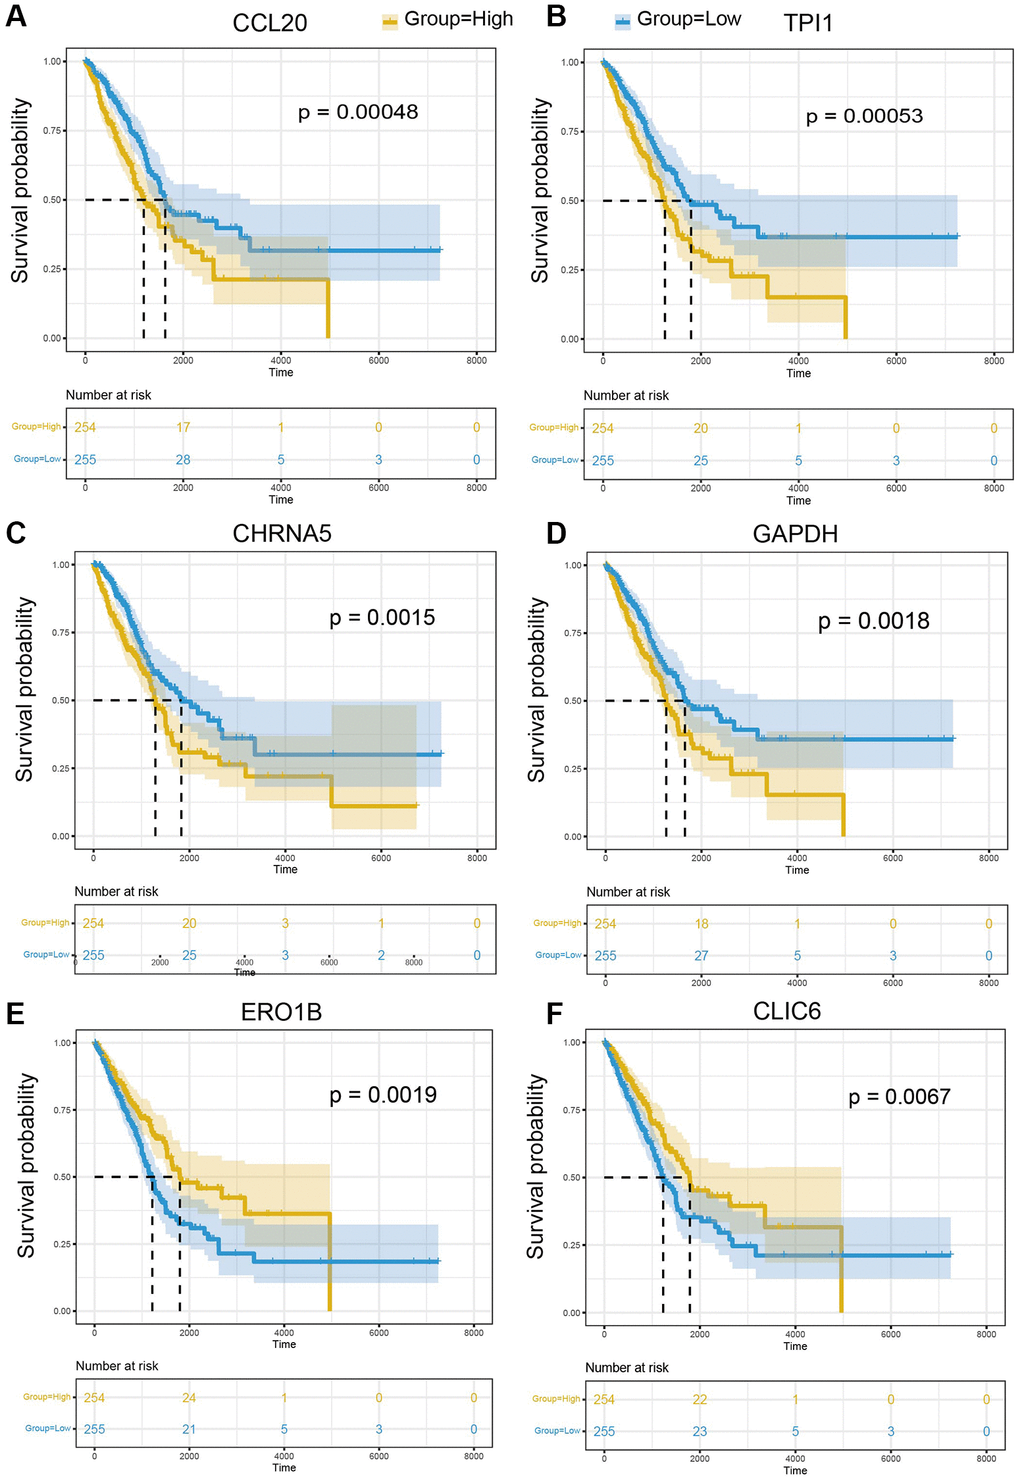
Figure 8.The prognostic significance of marker genes in LUAD. Kaplan-Meier survival curves of (A) CCL20, (B) TPI1, (C) CHRNA5, (D) GAPDH, (E) ERO1B, (F) CLIC6 in LUAD. The median of gene expression is utilized as the cut-off. Yellow: higher expression of indicated gene; Blue: lower expression of indicated gene.