Submit an Article
Navigate
Home
Editorial Board
Editorial Policies
Current Volume
Archive
Scientific Integrity
Publication Ethics Statements
Interviews with Outstanding Authors
Newsroom
Sponsored Conferences
Podcast
Contact
Special Collections
Submit an Article
Online ISSN: 1945-4589
Research Paper
|
Volume 15, Issue 12
|
pp. 5339–5354
Heterogeneity of tumor immune microenvironment in malignant and metastatic change in LUAD is revealed by single-cell RNA sequencing
Back to article
Figure 3
(3 of 8)
−
100%
+
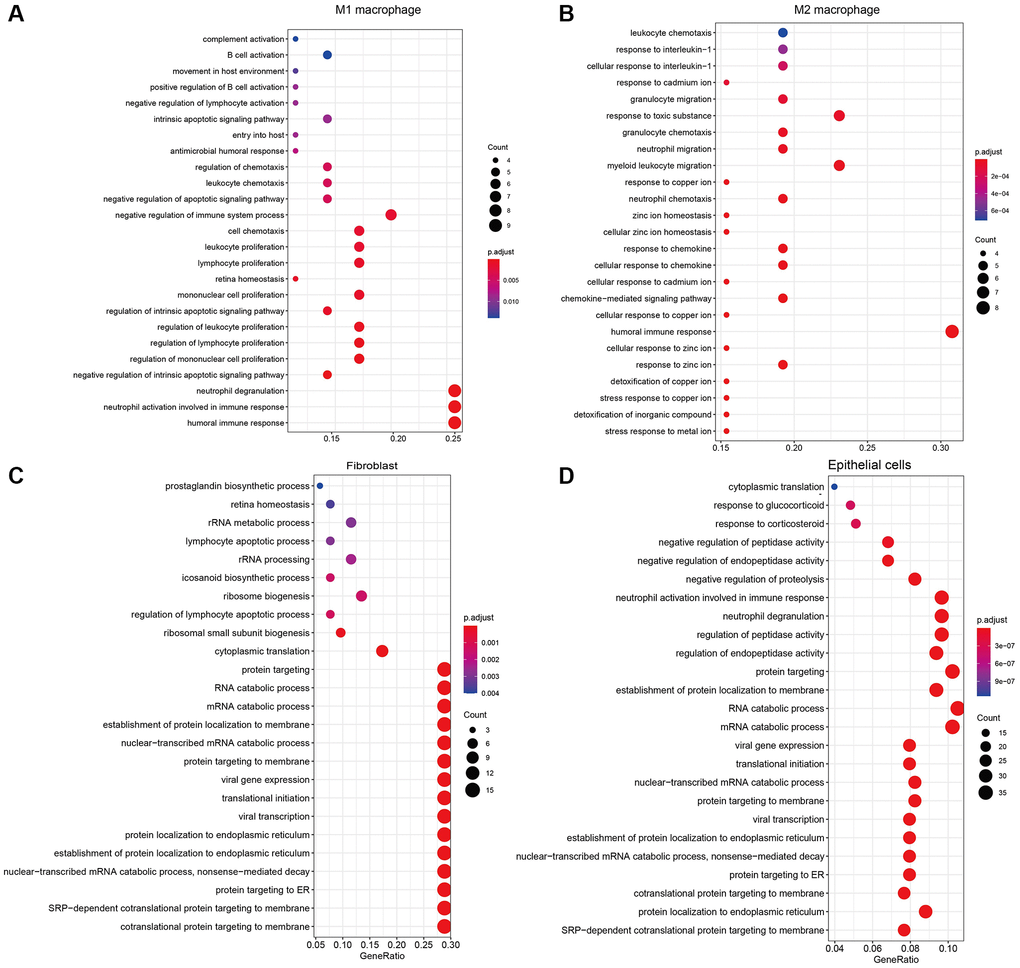
Figure 3.
The results of GO enrichment analysis for marker genes of (
A
) M1 macrophages, (
B
) M2 macrophages, (
C
) Fibroblasts, (
D
) Epithelial cells.