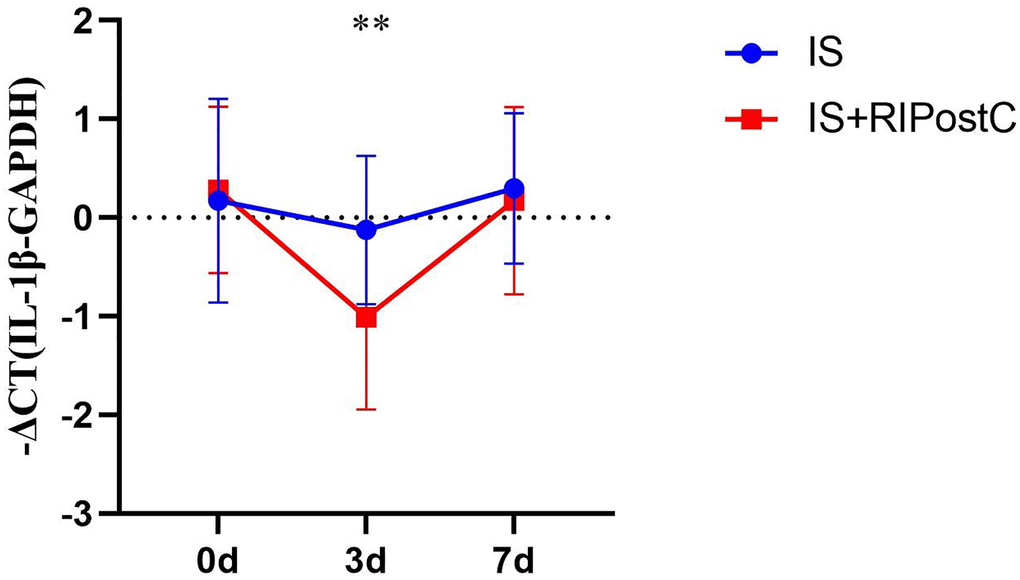
Figure 9.Change in IL-1β mRNA levels between RIPostC and conventional treatment groups. Conventional treatment group (IS, n = 24), RIPostC group (IS+RIPostC, n = 14). The data were not normally distributed. After normalization, ANOVA was performed to compare the differences in the percentage of cells between the two groups at each time point. **P < 0.01.