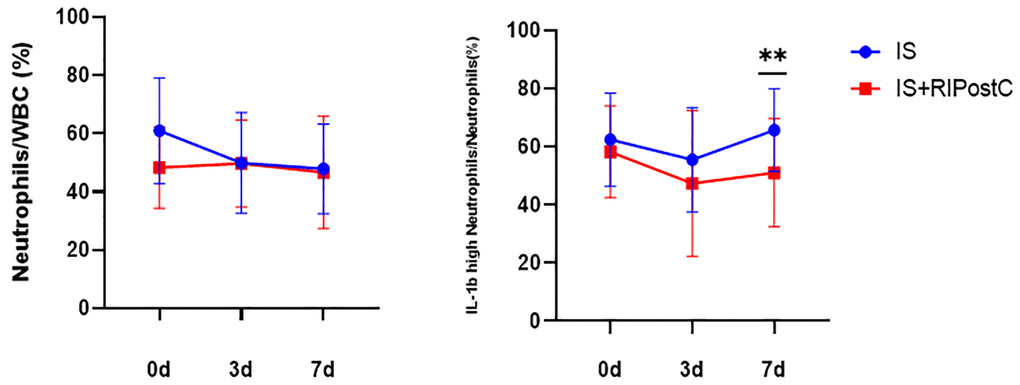
Figure 8.Changes in the percentage of neutrophils and pro-inflammatory neutrophils in the RIPostC group compared with those in the conventional treatment group. Conventional treatment group (IS, n = 24), RIPostC group (IS+RIPostC, n = 14). Data from both groups were normally distributed. ANOVA was used to compare the differences in the percentage of cells between the two groups at each time point. **P < 0.01.