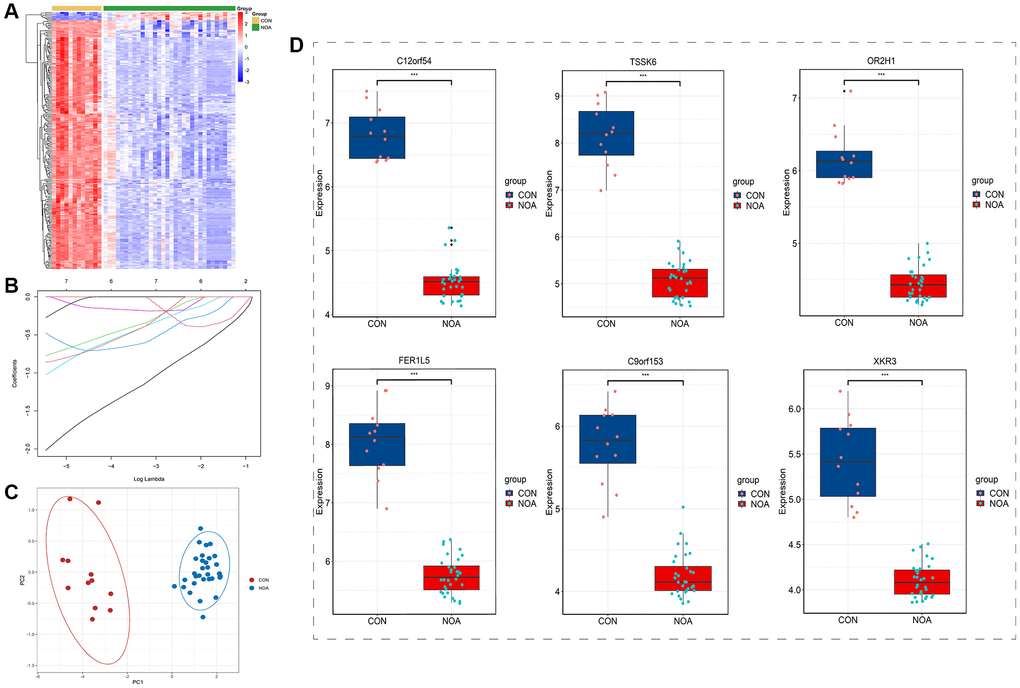
Figure 3.Boruta feature selection and lasso regression. (A) Heatmap of Boruta screened genes. (B) Lasso regression. (C) PCA plot of signature genes. (D) Expression of signature genes (C12orf54, TSSK6, OR2H1, FER1L5, C9orf153 and XKR3) in training datasets. (P < 0.05, Abbreviations: NOA: non-obstructive azoospermia; CON: control group).