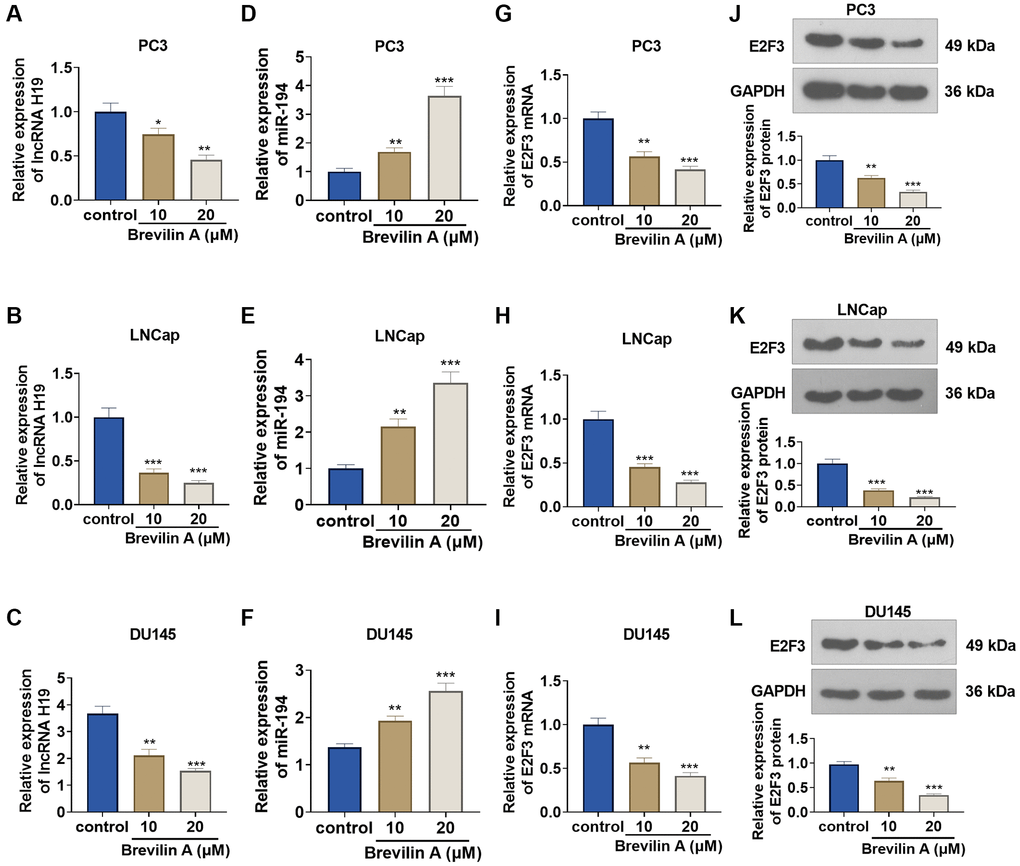
Figure 2.The impact of Brevilin A on lncRNA H19, miR-194, and E2F3 expressions. DU145 cells were treated at the concentrations of 10 μM and 20 μM, which were calculated through the IC50 values of Brevilin A. (A–I) qRT-PCR determined lncRNA H19 (A–C), miR-194 (D–F) and E2F3 mRNA (G–I) expressions. (J–L) Western blot measured E2F3 expression. *P < 0.05, **P < 0.01, ***P < 0.001 (vs. control), n = 3.