Submit an Article
Navigate
Home
Editorial Board
Editorial Policies
Current Volume
Archive
Scientific Integrity
Publication Ethics Statements
Interviews with Outstanding Authors
Newsroom
Sponsored Conferences
Podcast
Contact
Special Collections
Submit an Article
Online ISSN: 1945-4589
Research Paper
|
Volume 15, Issue 12
|
pp. 5304–5338
Construction and validation of a model based on immunogenic cell death-associated lncRNAs to predict prognosis and direct therapy for kidney renal clear cell carcinoma
Back to article
Figure 3
(3 of 8)
−
100%
+
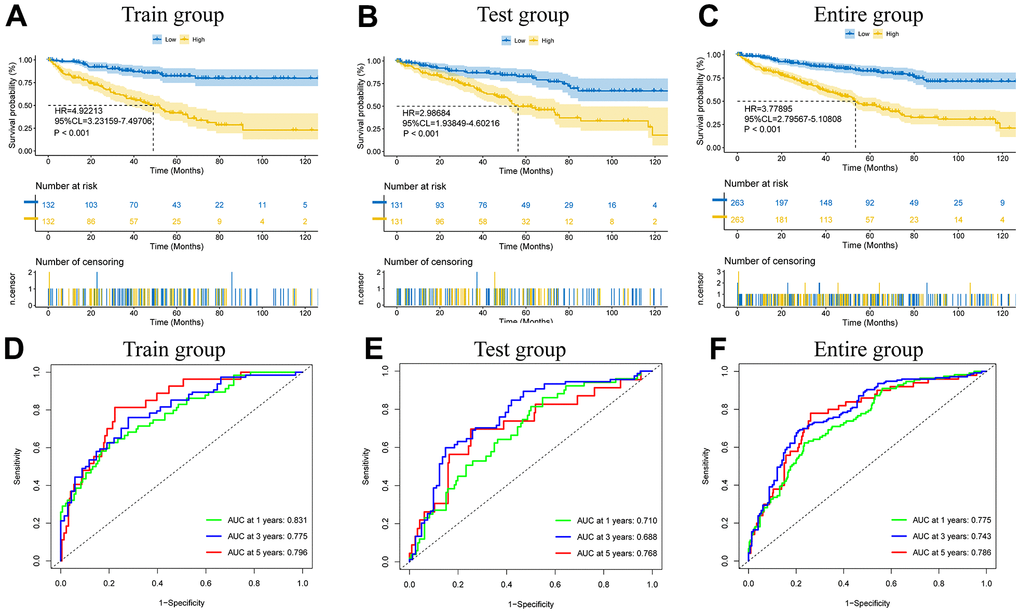
Figure 3.
The model prediction effect is validated by the training group, test group, and entire group.
K-M analysis (
A
–
C
) and Time-dependent ROC curves (
D
–
F
) to compare the survival of the high-risk group and low-risk group.