Submit an Article
Navigate
Home
Editorial Board
Editorial Policies
Current Volume
Archive
Scientific Integrity
Publication Ethics Statements
Interviews with Outstanding Authors
Newsroom
Sponsored Conferences
Podcast
Contact
Special Collections
Submit an Article
Online ISSN: 1945-4589
Research Paper
|
Volume 15, Issue 10
|
pp. 4334–4362
Plasma exosome proteomics reveals the pathogenesis mechanism of post-stroke cognitive impairment
Back to article
Figure 3
(3 of 12)
−
100%
+
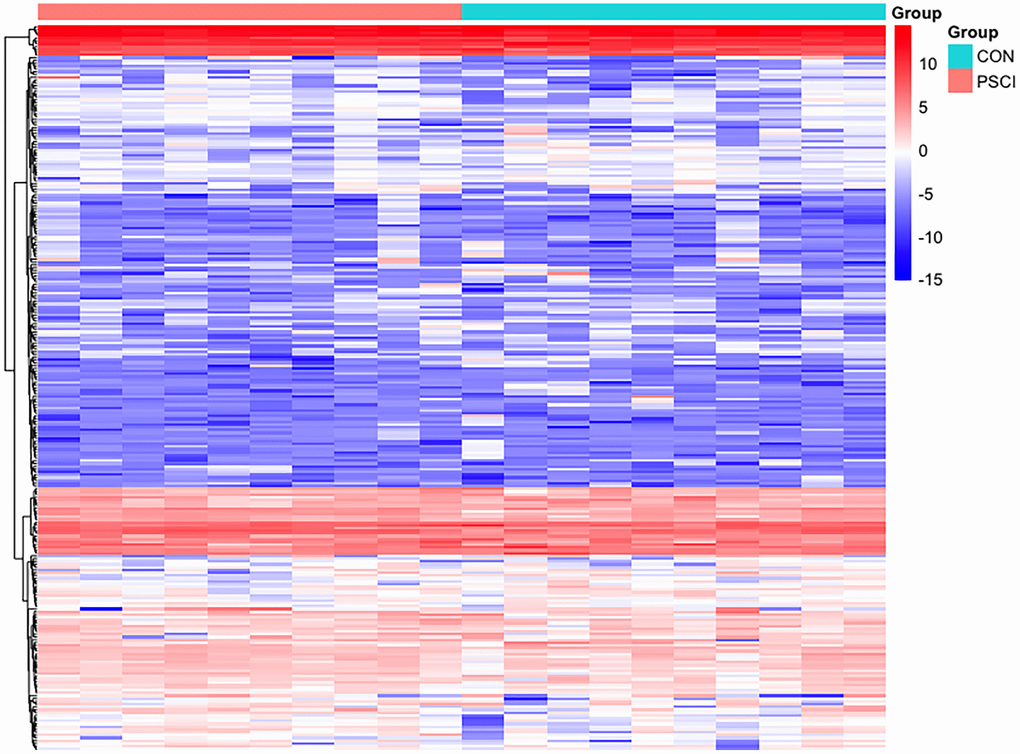
Figure 3.
Hierarchical clustering of plasma exosome proteomes.
The heat map represented the Z scores of all proteins quantified in Label-free quantitative proteomics.