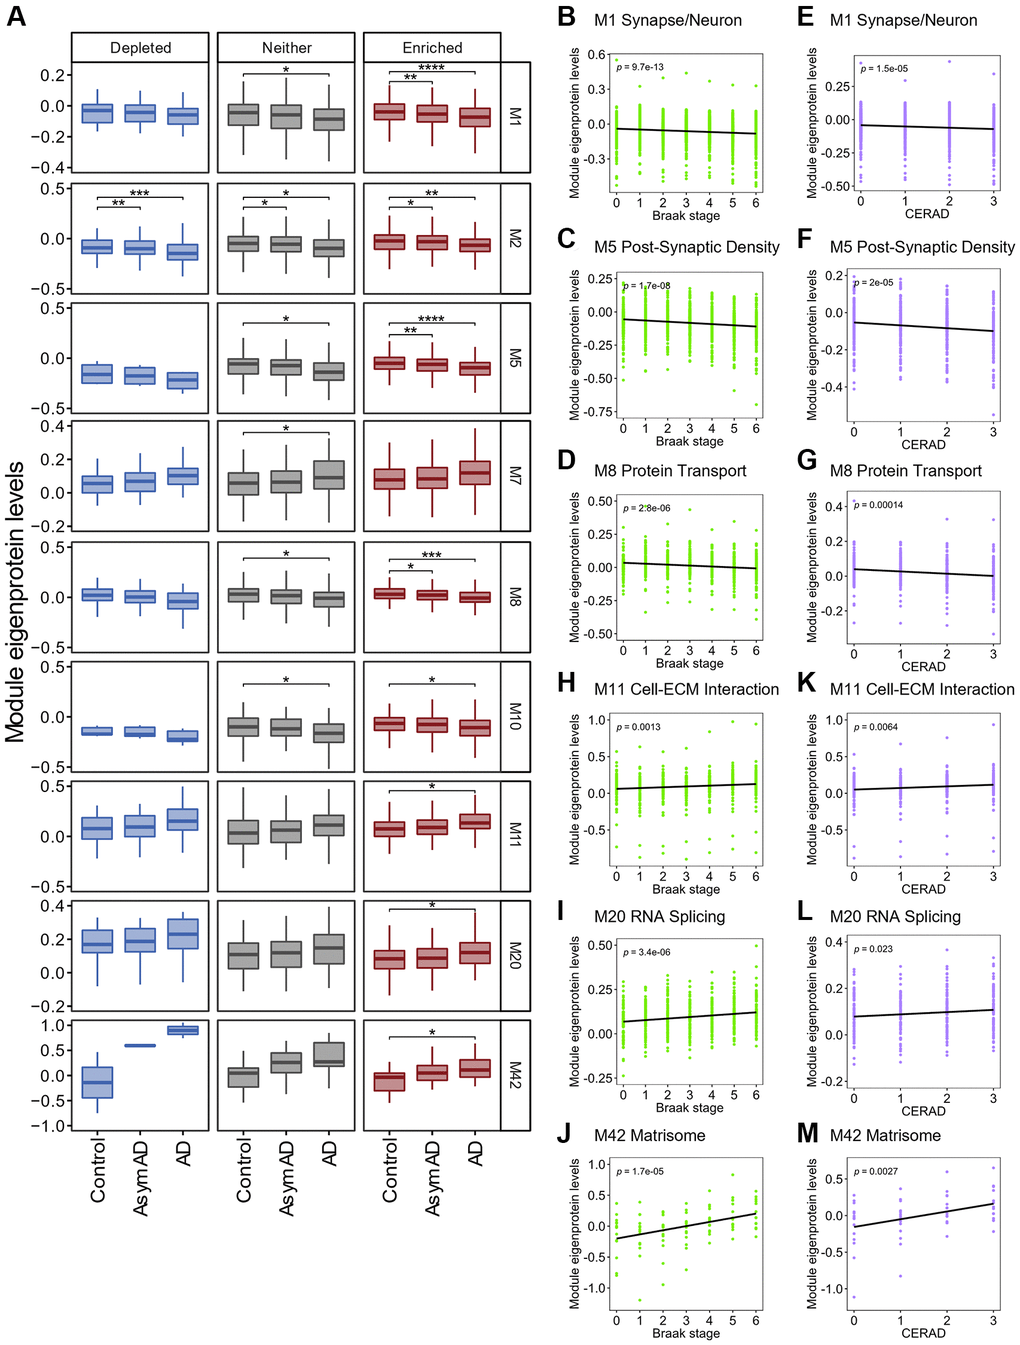
Figure 7.Association between SG-enriched RNAs and changes in protein levels in AD brains. (A) Box plot depicting Module eigenprotein levels by AD case status for the 9 modules statistically significant. Statistical significances were assessed by one-way ANOVA with Tukey test. No mark means not significant. *q < 0.05, **q < 0.01, ***q < 0.001, ****q < 0.0001. See also Supplementary Figure 4. (B–M) Plots showing Module eigenprotein levels of six SG-enriched RNA associated modules by BRAAK and CERAD scores. p indicates p-value for Pearson correlation coefficient.