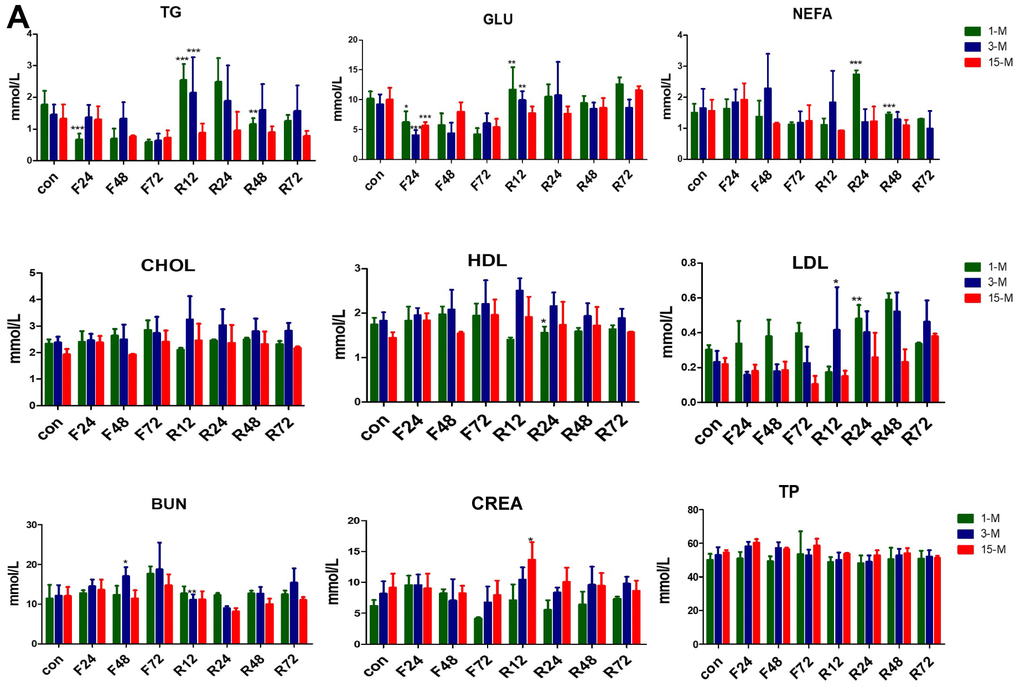
Figure 4.Serum concentrations of metabolites in the three groups of mice subjected to fasting and refeeding. (A) All data are presented as the mean ± SEM. * p < 0.05; ** p < 0.01; *** p <0.001.
Figure 4 — Plasticity of adipose tissues in response to fasting and refeeding declines with aging in mice | Aging