Submit an Article
Navigate
Home
Editorial Board
Editorial Policies
Current Volume
Archive
Scientific Integrity
Publication Ethics Statements
Interviews with Outstanding Authors
Newsroom
Sponsored Conferences
Podcast
Contact
Special Collections
Submit an Article
Online ISSN: 1945-4589
Research Paper
|
Volume 15, Issue 10
|
pp. 4269–4287
Systematic pan-cancer analysis identifies cuproptosis-related gene DLAT as an immunological and prognostic biomarker
Back to article
Figure 11
(11 of 12)
−
100%
+
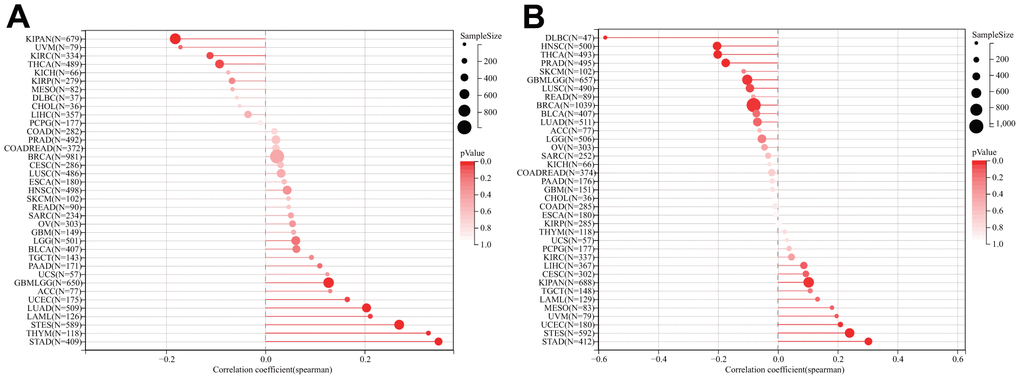
Figure 11.
Relationship of DLAT expression and TMB and MSI.
(
A
) Lollipop chart illustrating the relationship between DLAT expression and TMB. (
B
) Lollipop chart illustrating the relationship between DLAT expression and MSI.