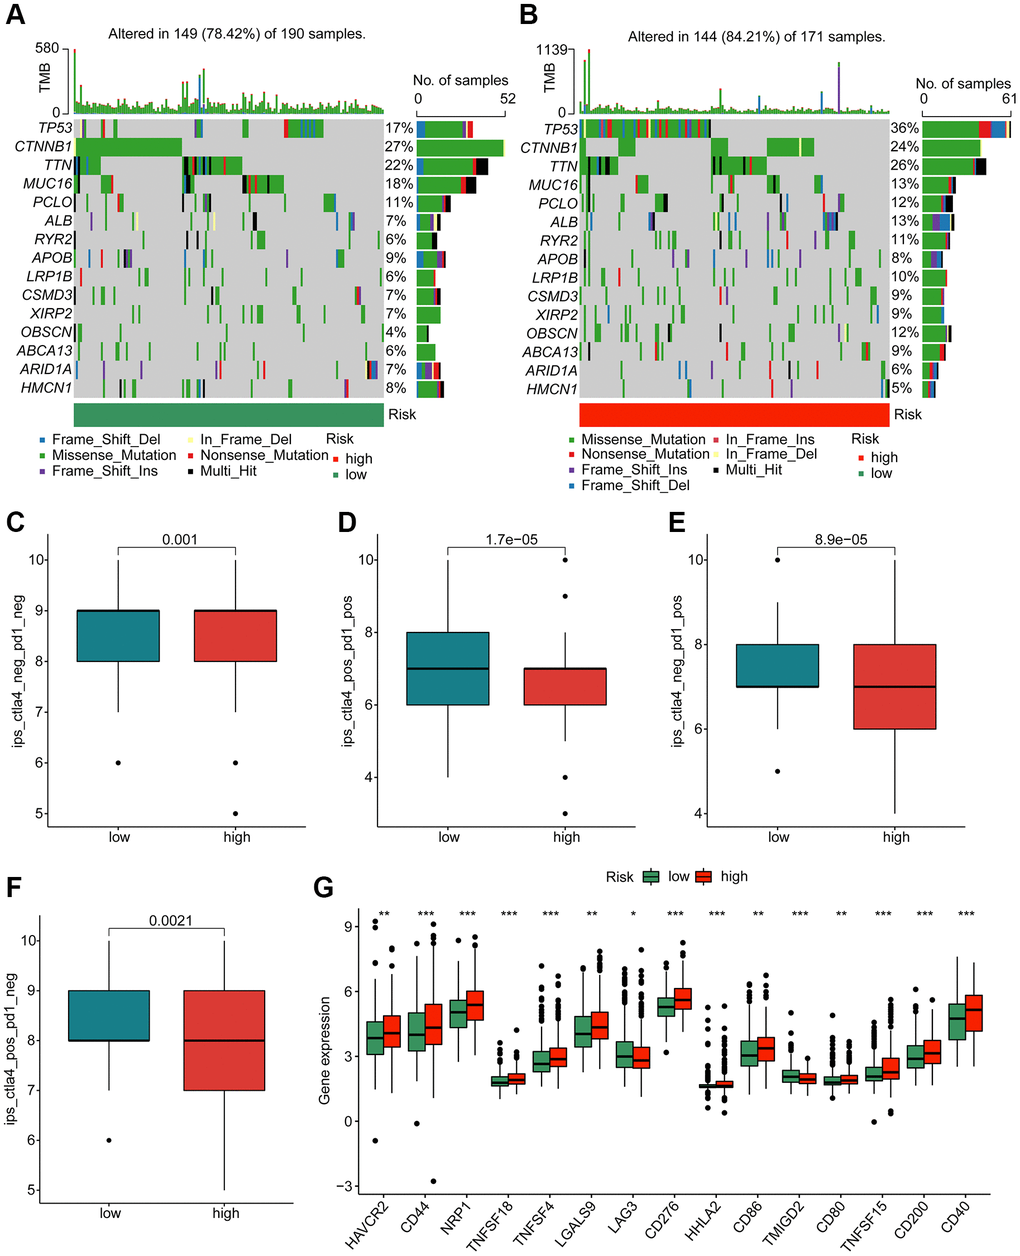
Figure 9.Genetic mutation characteristic and immunotherapy response of risk subgroups. Evaluation of somatic mutation landscape of HCC samples in (A) low- and (B) high-risk groups. (C–F) Immunotherapy response exploration of risk subgroups. (G) Difference analysis of immune checkpoints in the risk subgroups.