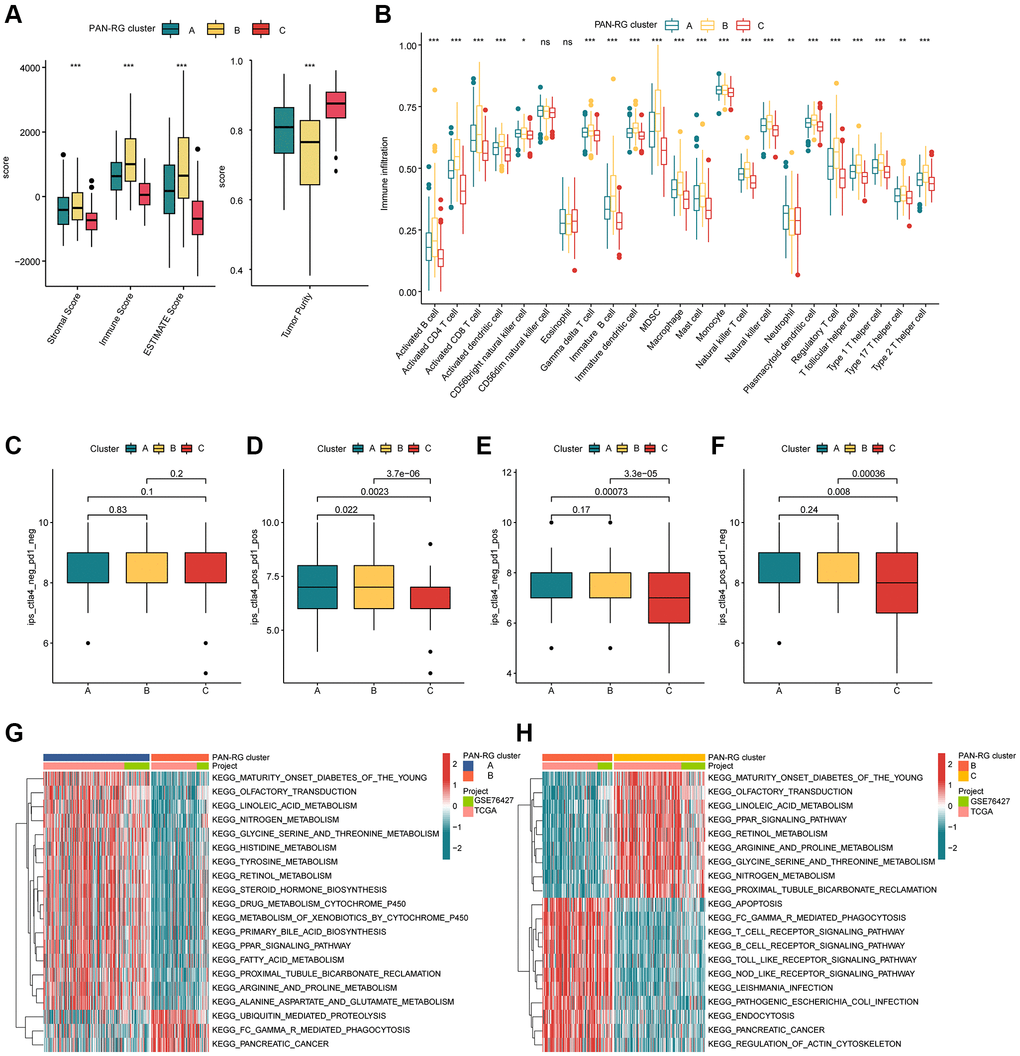
Figure 3.The TME characteristic of HCC in the PAN-RG molecular subgroups. (A) Evaluation of ESTIMATE score in PAN-RG cluster subtypes. (B) The immune infiltration exploration of HCC in PAN-RG cluster A, B, and C. (C–F) Immunotherapy response investigation of PAN-RG molecular subgroups via TCIA database. (G, H) GSVA algorithm shows the different regulation KEGG pathways in PAN-RG cluster A, B, and C.