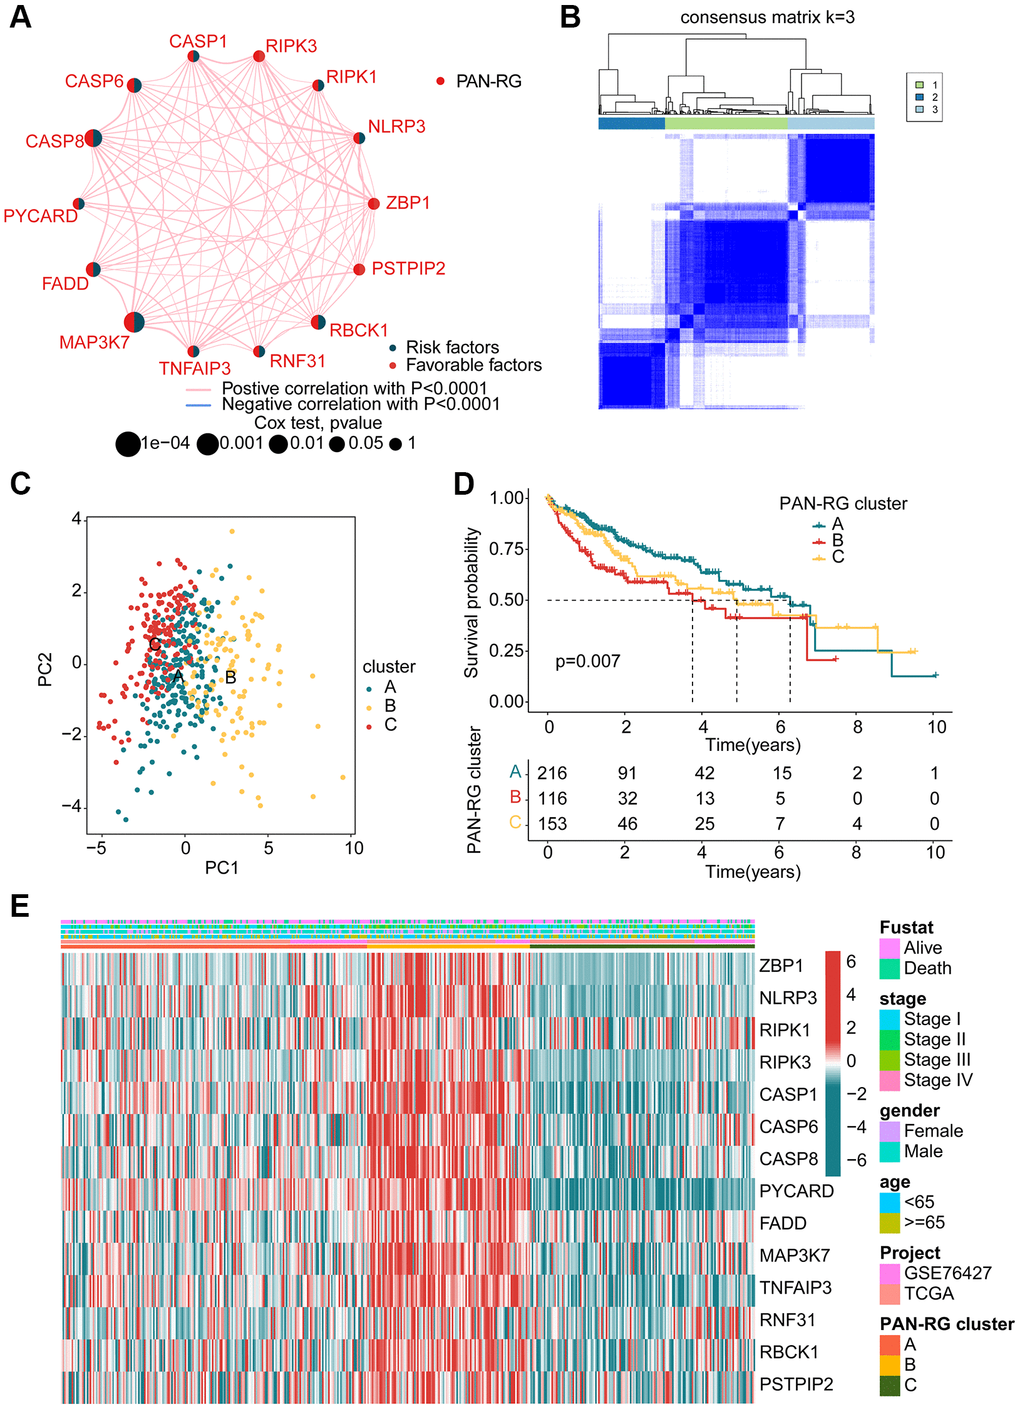
Figure 2.Identification of molecular subtypes of PAN-RGs for HCC. (A) Prognostic factor exploration of PAN-RGs. (B) Unsupervised consensus clustering analysis. (C) PCA diagram of HCC samples in cluster A, B, and C. (D) Clinical prognostic outcome of HCC in different PAN-RG cluster subgroups. (E) Expression of PAN-RGs in different PAN-RG cluster subgroups and clinical features.