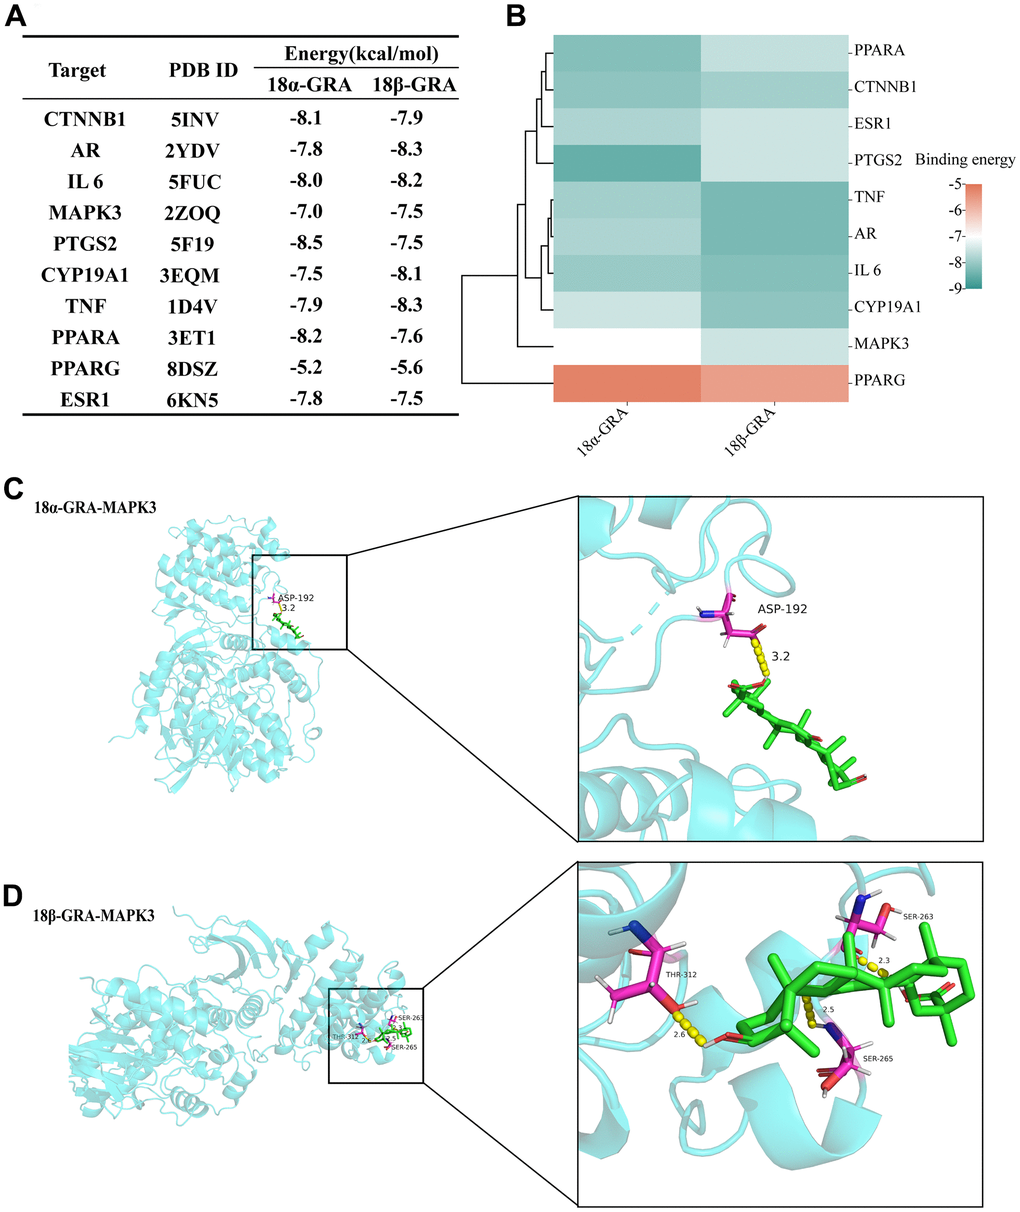
Figure 6.The results of molecular docking. (A) The results of molecular docking binding energy. (B) Heat map of molecular docking binding energy. (C) 18α-GRA and MAPK3 molecular docking visualization. (D) 18β-GRA and MAPK3 molecular docking visualization.