Submit an Article
Navigate
Home
Editorial Board
Editorial Policies
Current Volume
Archive
Scientific Integrity
Publication Ethics Statements
Interviews with Outstanding Authors
Newsroom
Sponsored Conferences
Podcast
Contact
Special Collections
Submit an Article
Online ISSN: 1945-4589
Research Paper
|
Volume 15, Issue 9
|
pp. 3839–3856
Exploring the molecular mechanism of glycyrrhetinic acid in the treatment of gastric cancer based on network pharmacology and experimental validation
Back to article
Figure 5
(5 of 8)
−
100%
+
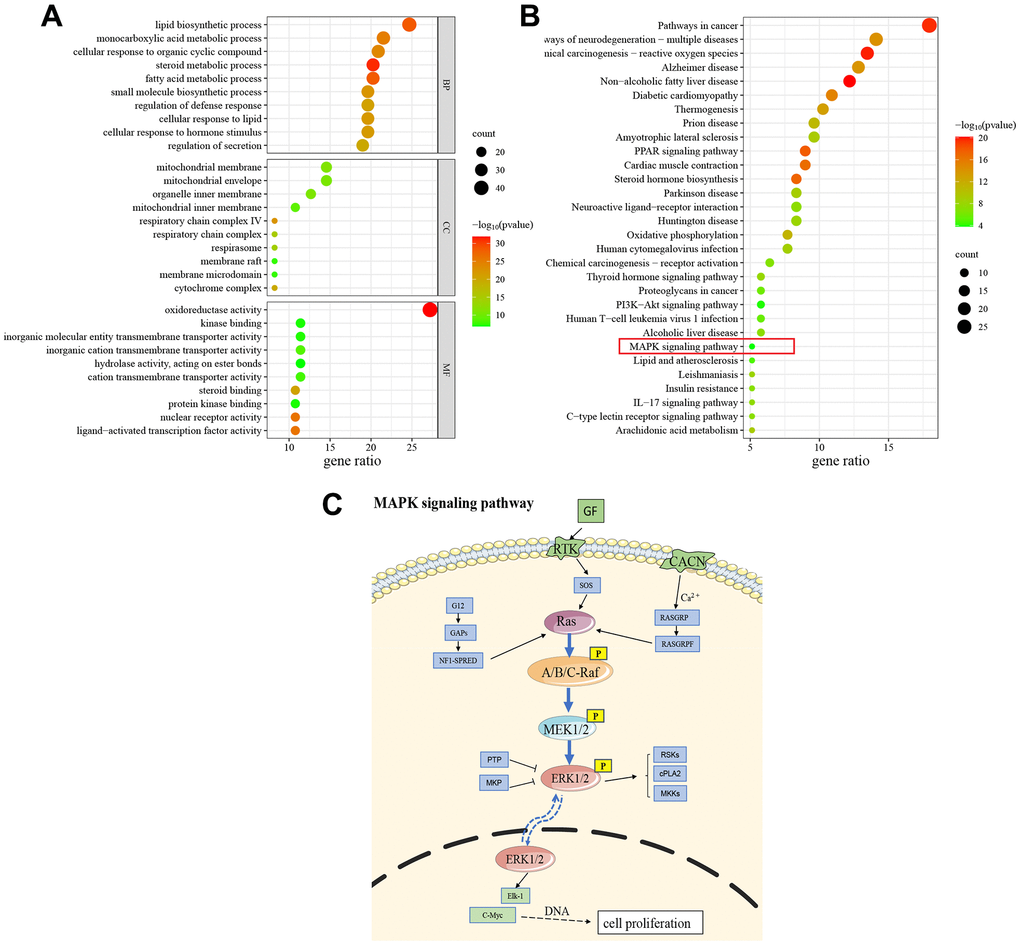
Figure 5.
GO and KEGG enrichment analysis.
(
A
) The results of GO enrichment analysis (Top 10). (
B
) The results of KEGG pathway enrichment analysis (Top 30). (
C
) Schematic drawing of the MAPK signaling pathway.