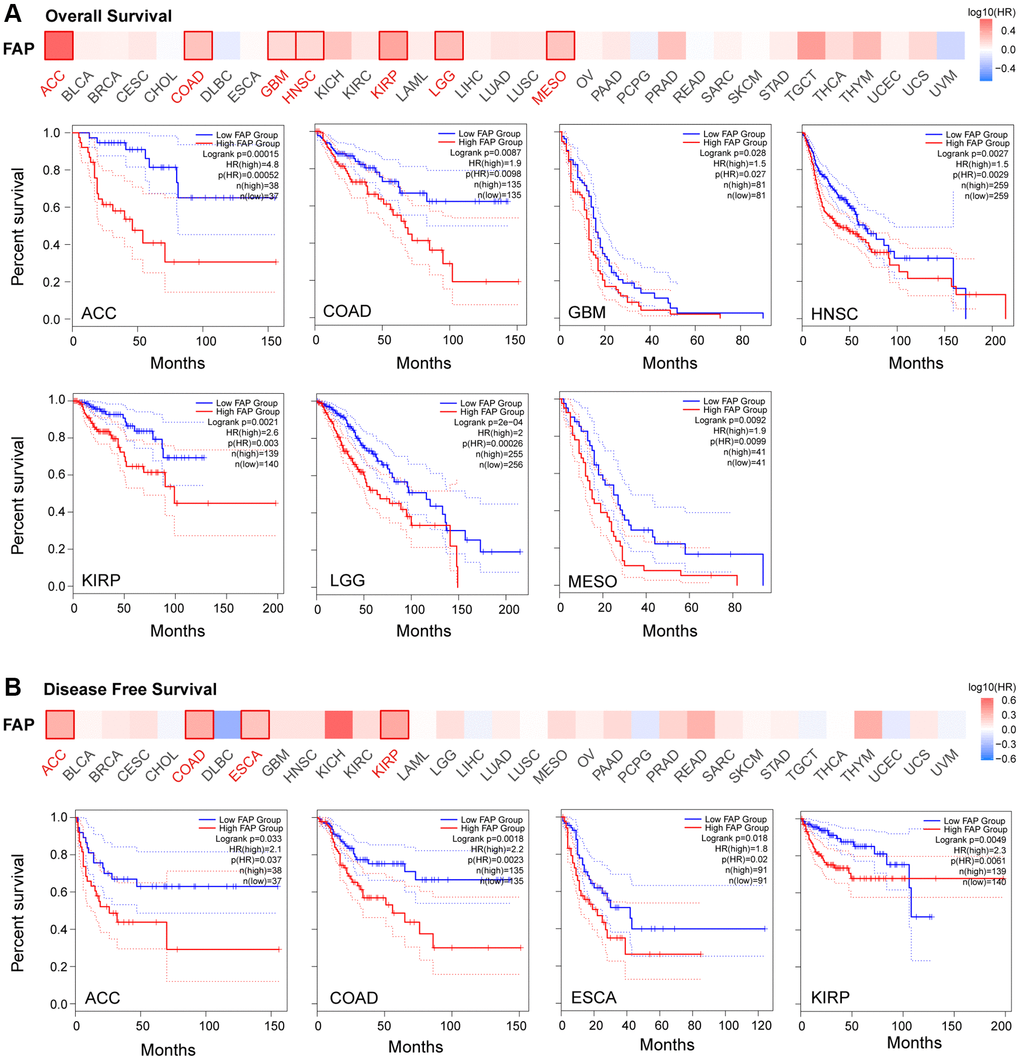
Figure 2.Correlation between FAP gene expression and survival prognosis in TCGA cancers. Overall Survival analysis (A) and Disease Free Survival analysis (B) were performed in diverse cancers. A cutoff value of 50% was used to split the FAP high-expression and low-expression cohorts. The log-rank test was used in the hypothesis.