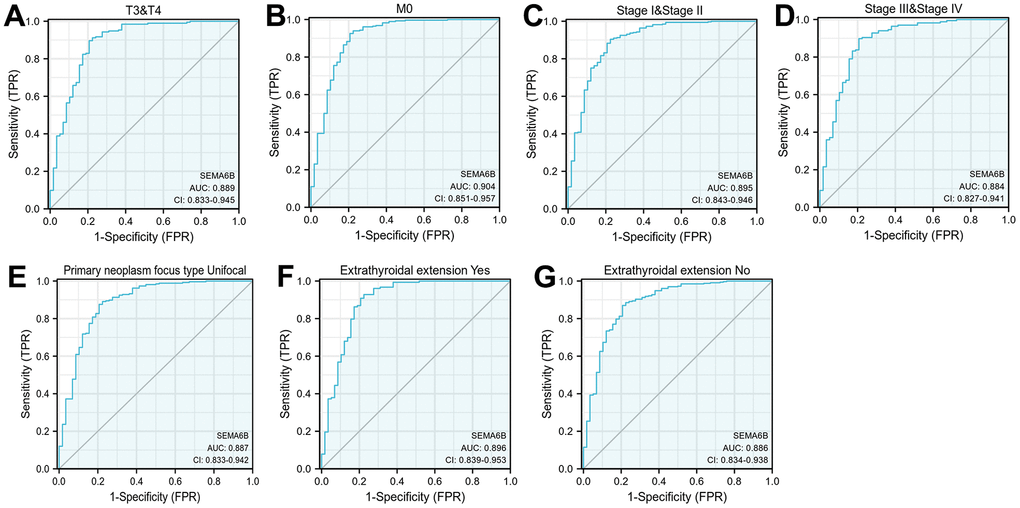
Figure 4.Diagnostic value analysis of SEMA6B expression in THCA. ROC curve indicated the sensitivity and specificity of SEMA6B expression in THCA subgroup differentiation including TNM staging (A, B), pathologic staging (C, D), primary neoplasm focus (E), extrathyroidal extension (F, G) (n=455).