Submit an Article
Navigate
Home
Editorial Board
Editorial Policies
Current Volume
Archive
Scientific Integrity
Publication Ethics Statements
Interviews with Outstanding Authors
Newsroom
Sponsored Conferences
Podcast
Contact
Special Collections
Submit an Article
Online ISSN: 1945-4589
Research Paper
|
Volume 15, Issue 10
|
pp. 3939–3966
Circulating immune cell phenotypes are associated with age, sex, CMV, and smoking status in the Framingham Heart Study offspring participants
Back to article
Figure 5
(5 of 5)
−
100%
+
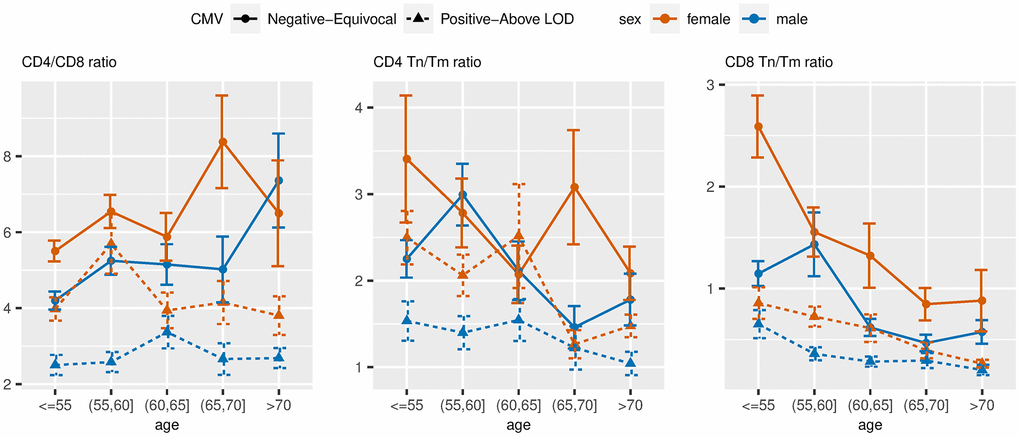
Figure 5.
Unadjusted mean values of ARIP measures stratified by age, sex and two-category CMV status.
Note: Tn = naïve T cells; Tm = memory T cells.