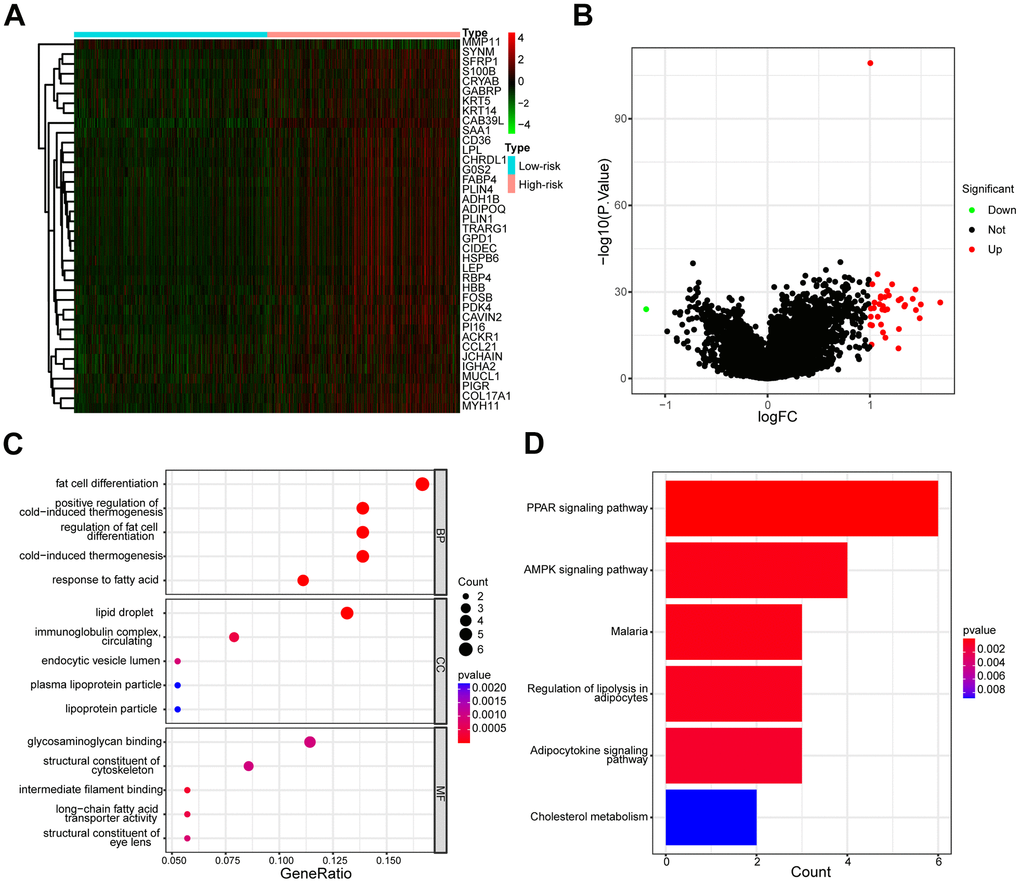
Figure 10.Different gene expression profiles and functional analysis of low- and high-risk groups. (A) The heatmap of the expression differences in low- and high-risk groups. (B) The volcanic map depicted dysregulated genes between low- and high-risk groups. (C) The enrichment map illustrated GO annotation analysis of DEGs between low- and high-risk groups. (D) The enrichment map illustrated the KEGG pathway analysis of DEGs between low- and high-risk groups.