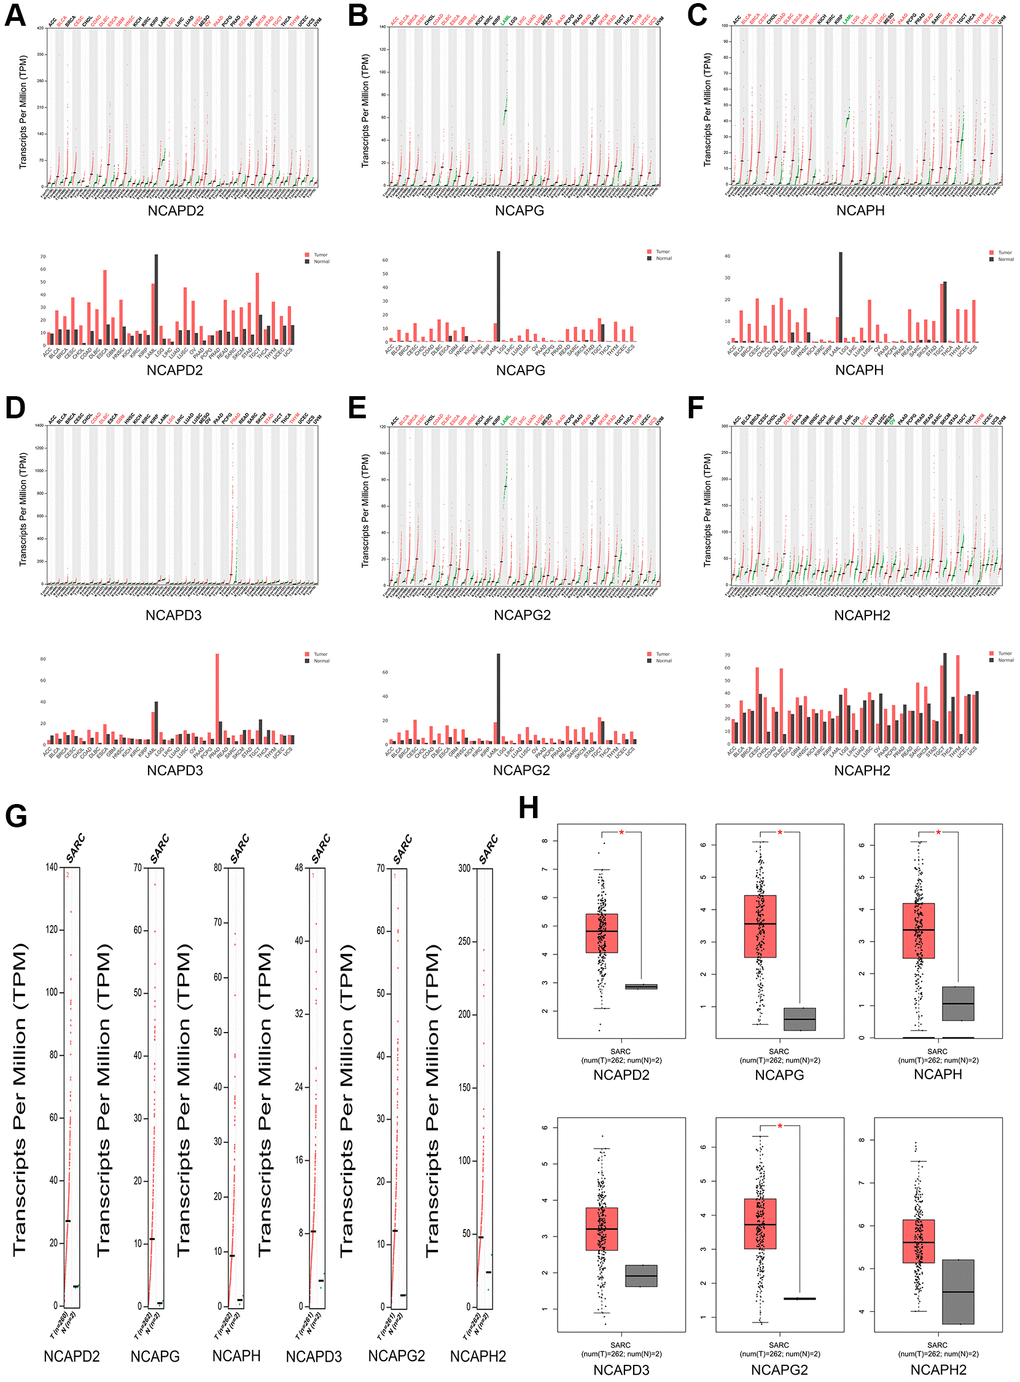
Figure 3.The expression levels of NCAP genes in sarcoma. (A–F) The expression levels of NCAPD2, NCAPG, NCAPD3, NCAPG2, NCAPH, and NCAPH2 in pan-cancer, (G, H) The expression levels of NCAP genes in sarcoma. Each dot represents an individual sample, *P < 0.05.