Submit an Article
Navigate
Home
Editorial Board
Editorial Policies
Current Volume
Archive
Scientific Integrity
Publication Ethics Statements
Interviews with Outstanding Authors
Newsroom
Sponsored Conferences
Podcast
Contact
Special Collections
Submit an Article
Online ISSN: 1945-4589
Research Paper
|
Volume 15, Issue 8
|
pp. 3171–3190
Development and validation of novel prognostic models for zinc finger proteins-related genes in soft tissue sarcoma
Back to article
Figure 2
(2 of 9)
−
100%
+
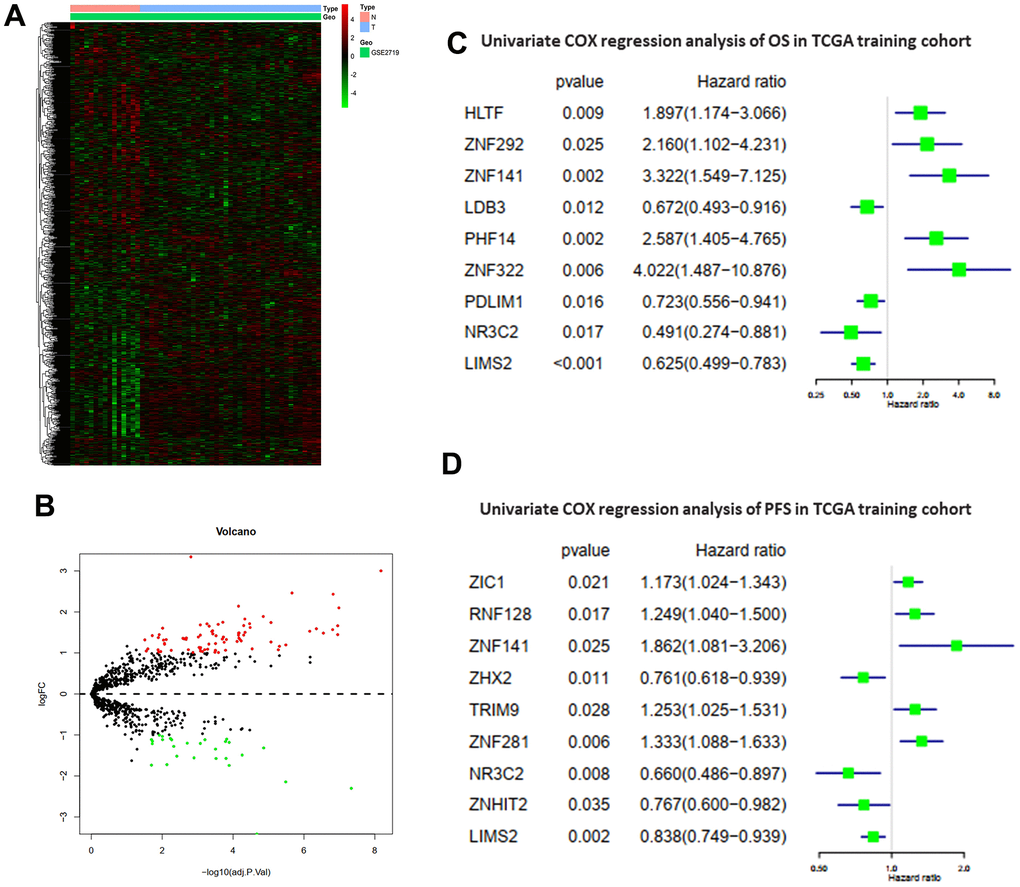
Figure 2.
Differentially expressed ZNFs and univariate Cox regression analysis.
Heatmap (
A
) and volcano plot (
B
) of 1,555 ZNFs in normal and STS tissues from GSE2719. Univariate Cox regression analysis of OS (
C
) and PFS (
D
) in TCGA training cohort.