Submit an Article
Navigate
Home
Editorial Board
Editorial Policies
Current Volume
Archive
Scientific Integrity
Publication Ethics Statements
Interviews with Outstanding Authors
Newsroom
Sponsored Conferences
Podcast
Contact
Special Collections
Submit an Article
Online ISSN: 1945-4589
Research Paper
|
Volume 15, Issue 9
|
pp. 3273–3294
Renal dysfunction, malignant neoplasms, atherosclerotic cardiovascular diseases, and sarcopenia as key outcomes observed in a three-year follow-up study using the Werner Syndrome Registry
Back to article
Figure 1
(1 of 2)
−
100%
+
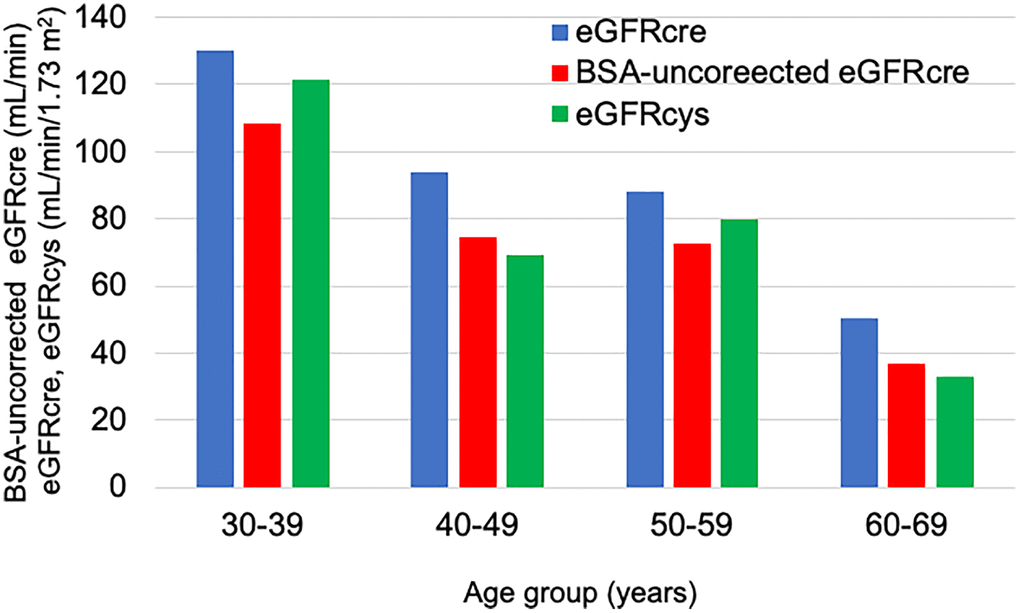
Figure 1.
Average renal function in each age group over the entire survey period.
The blue bar shows the eGFRcre. The red bar shows the BSA-uncorrected eGFRcre. The green bar shows the eGFRcys.