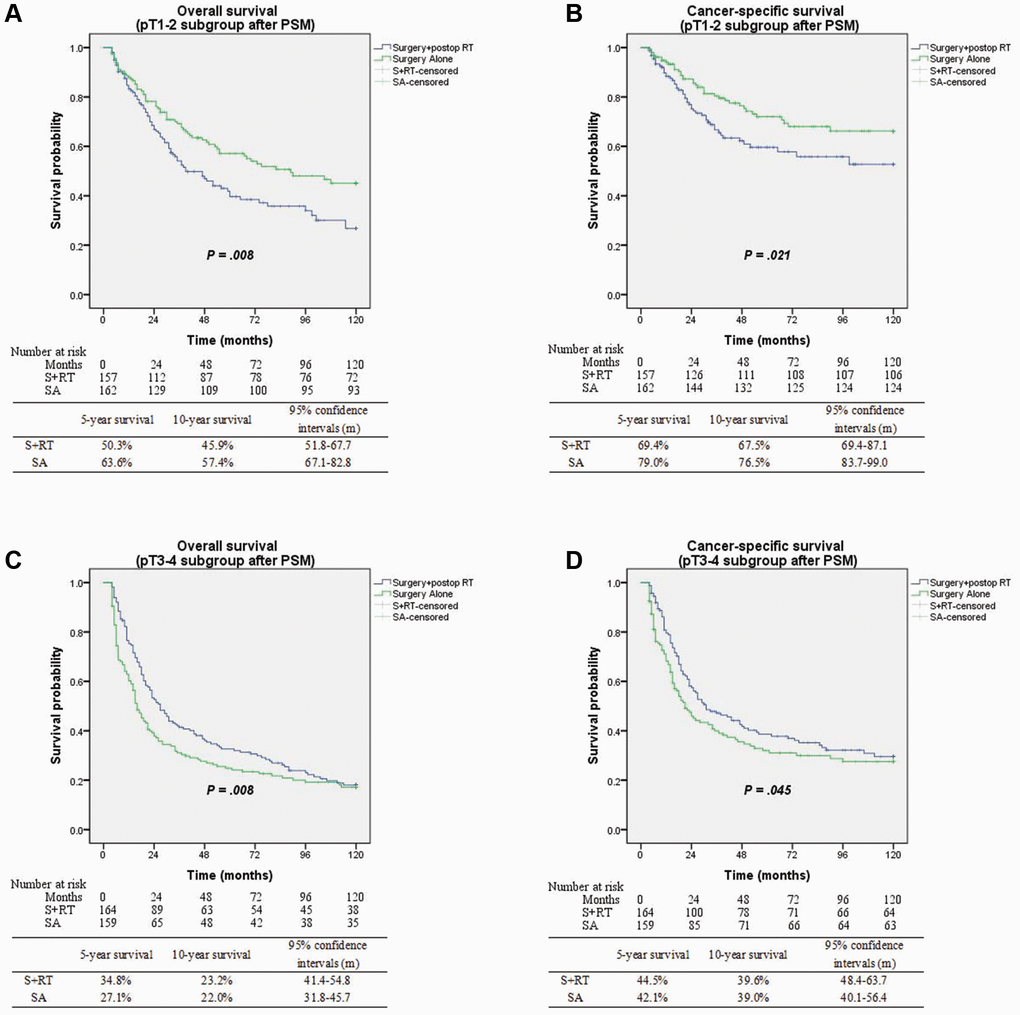
Figure 4.(A) Overall survival between surgery alone and surgery + postop RT groups with pT1-2 subgroup (p = 0.008). (B) Cancer-specific survival between surgery alone and surgery + postop RT groups with pT1-2 subgroup (p = 0.021). (C) Overall survival between surgery alone and surgery + postop RT groups with pT3-4 subgroup (p = 0.008). (D) Cancer-specific survival between surgery alone and surgery + postop RT groups with pT3-4 subgroup (p = 0.045).