Submit an Article
Navigate
Home
Editorial Board
Editorial Policies
Current Volume
Archive
Scientific Integrity
Publication Ethics Statements
Interviews with Outstanding Authors
Newsroom
Sponsored Conferences
Podcast
Contact
Special Collections
Submit an Article
Online ISSN: 1945-4589
Research Paper
|
Volume 15, Issue 8
|
pp. 3141–3157
Profiling and integrated analysis of transcriptional addiction gene expression and prognostic value in hepatocellular carcinoma
Back to article
Figure 1
(1 of 10)
−
100%
+
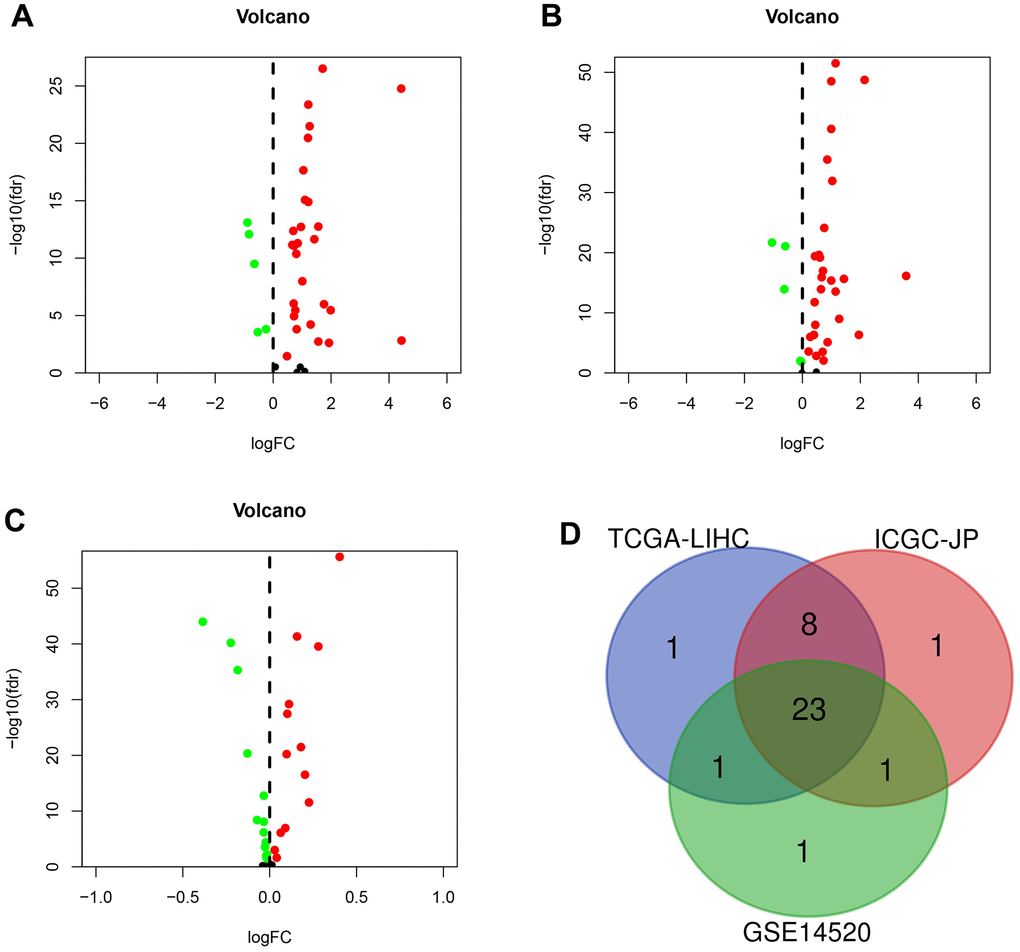
Figure 1.
The differentially expressed genes (DEGs) were screened in different sets.
(
A
) DEGs (n = 33) in TCGA-LIHC set. (
B
) DEGs (n = 33) in the ICGC-JP set. (
C
) DEGs (n = 26) in GEO-GSE14520 set. (
D
) Venn diagram for the overlapping genes.