Submit an Article
Navigate
Home
Editorial Board
Editorial Policies
Current Volume
Archive
Scientific Integrity
Publication Ethics Statements
Interviews with Outstanding Authors
Newsroom
Sponsored Conferences
Podcast
Contact
Special Collections
Submit an Article
Online ISSN: 1945-4589
Research Paper
|
Volume 15, Issue 9
|
pp. 3427–3441
Biological and immunological significance of DLL3 expression in different tumor tissues: a pan-cancer analysis
Back to article
Figure 10
(10 of 10)
−
100%
+
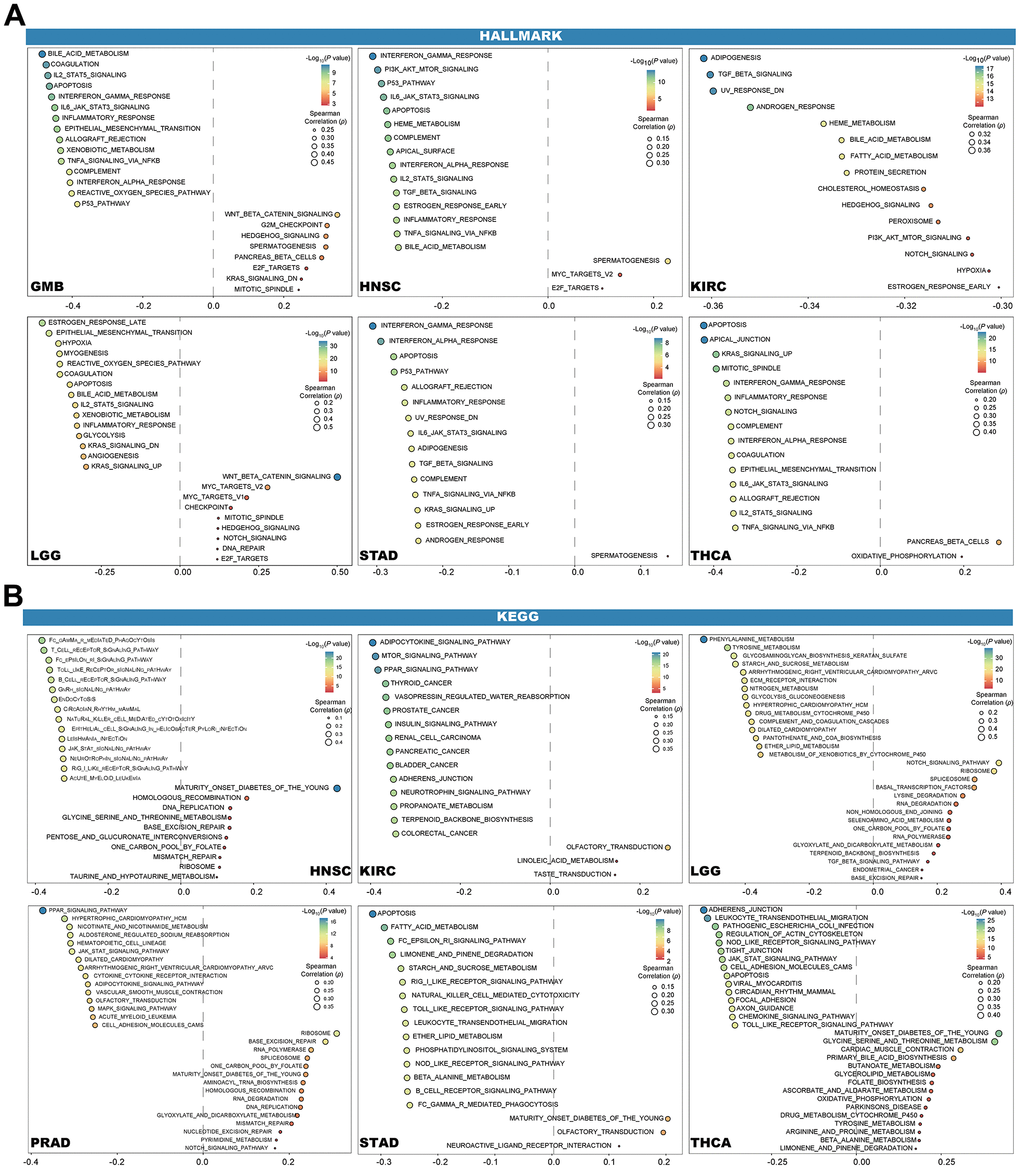
Figure 10.
Results of GSVA.
Bubble plot show the 15 pathways of Hallmark (
A
) and KEGG (
B
) with the most significant positive and negative, respectively.