Submit an Article
Navigate
Home
Editorial Board
Editorial Policies
Current Volume
Archive
Scientific Integrity
Publication Ethics Statements
Interviews with Outstanding Authors
Newsroom
Sponsored Conferences
Podcast
Contact
Special Collections
Submit an Article
Online ISSN: 1945-4589
Research Paper
|
Volume 15, Issue 8
|
pp. 3064–3093
Cellular senescence-related gene signature as a valuable predictor of prognosis in hepatocellular carcinoma
Back to article
Figure 3
(3 of 12)
−
100%
+
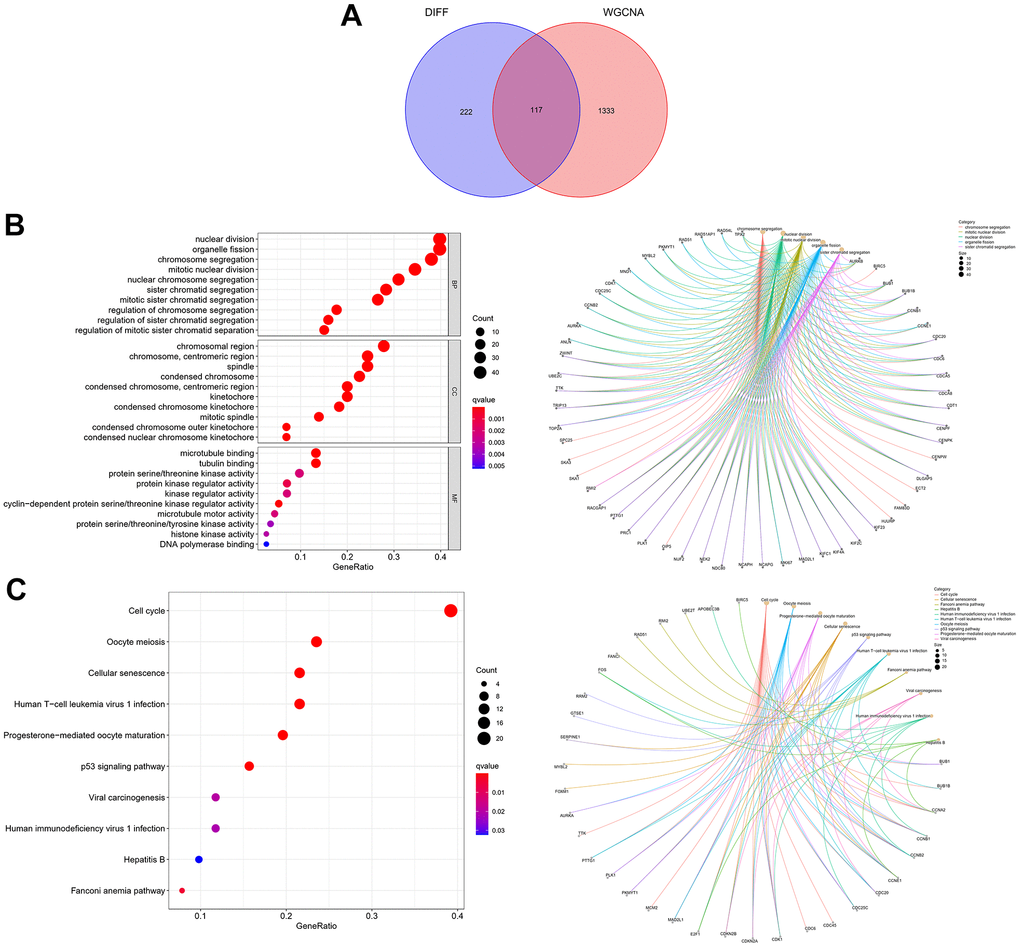
Figure 3.
Expression of the 117 cellular senescence-related DEGs and their functions.
(
A
) The Venn diagram shows an overlap of the differential analysis and WGCNA results. (
B
) GO function analysis. (
C
) KEGG pathways analysis.