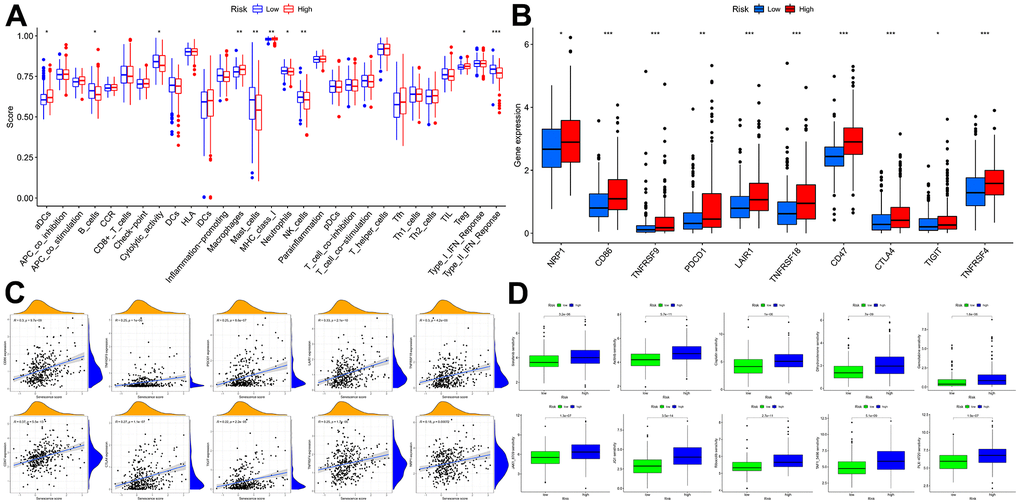
Figure 11.Immune function and immunotherapy comparisons between the two risk groups. (A) Immune function analysis. (B) Immune checkpoint analysis between risk groups. (C) Relevance between senescence score and immune checkpoints expression. (D) Comparison sensitivity of targeted therapeutic drugs of individuals in different risk groups.