Submit an Article
Navigate
Home
Editorial Board
Editorial Policies
Current Volume
Archive
Scientific Integrity
Publication Ethics Statements
Interviews with Outstanding Authors
Newsroom
Sponsored Conferences
Podcast
Contact
Special Collections
Submit an Article
Online ISSN: 1945-4589
Research Paper
|
Volume 15, Issue 8
|
pp. 3052–3063
Association between red blood cell distribution width and ischemic stroke recurrence in patients with acute ischemic stroke: a 10-years retrospective cohort analysis
Back to article
Figure 3
(3 of 3)
−
100%
+
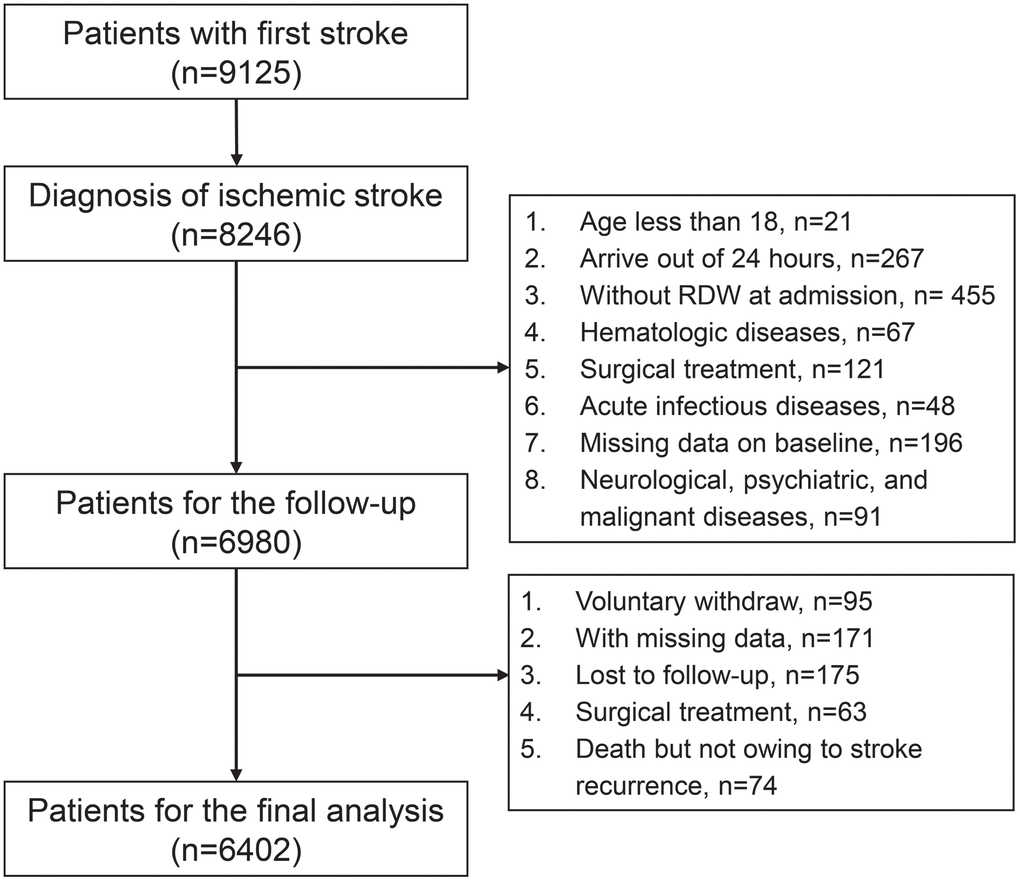
Figure 3.
Flow chart of enrollment of participants in the study.