Submit an Article
Navigate
Home
Editorial Board
Editorial Policies
Current Volume
Archive
Scientific Integrity
Publication Ethics Statements
Interviews with Outstanding Authors
Newsroom
Sponsored Conferences
Podcast
Contact
Special Collections
Submit an Article
Online ISSN: 1945-4589
Research Paper
|
Volume 15, Issue 9
|
pp. 3410–3426
Development and validation of a novel anoikis-related gene signature for predicting prognosis in ovarian cancer
Back to article
Figure 1
(1 of 8)
−
100%
+
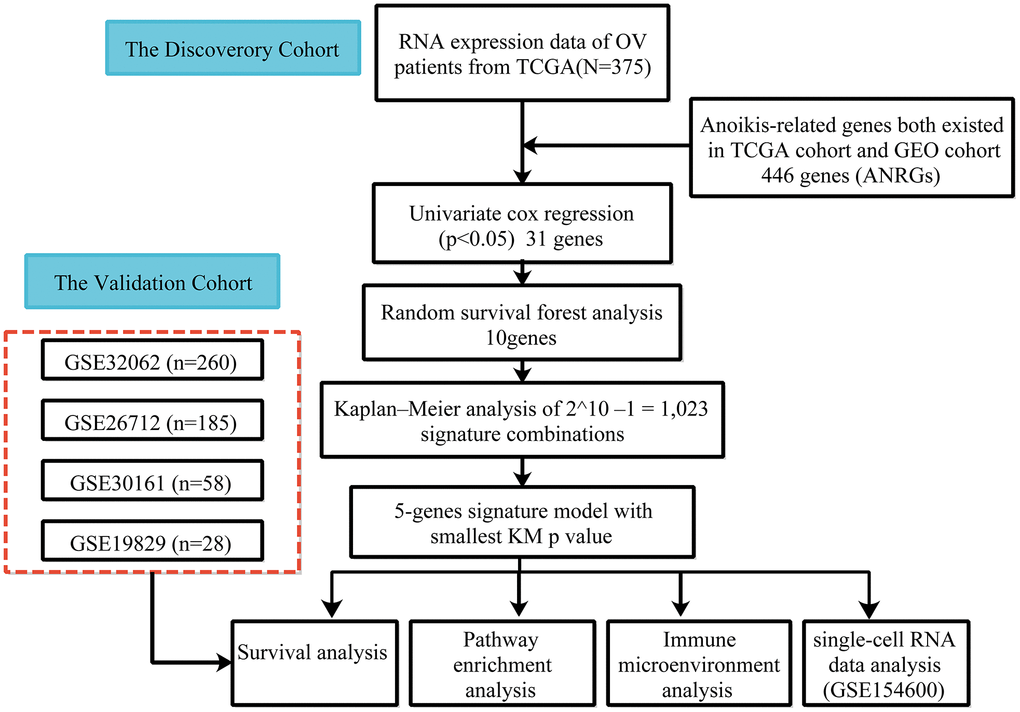
Figure 1.
Flow chart of data collection and analysis.
Figure 1 — Development and validation of a novel anoikis-related gene signature for predicting prognosis in ovarian cancer | Aging