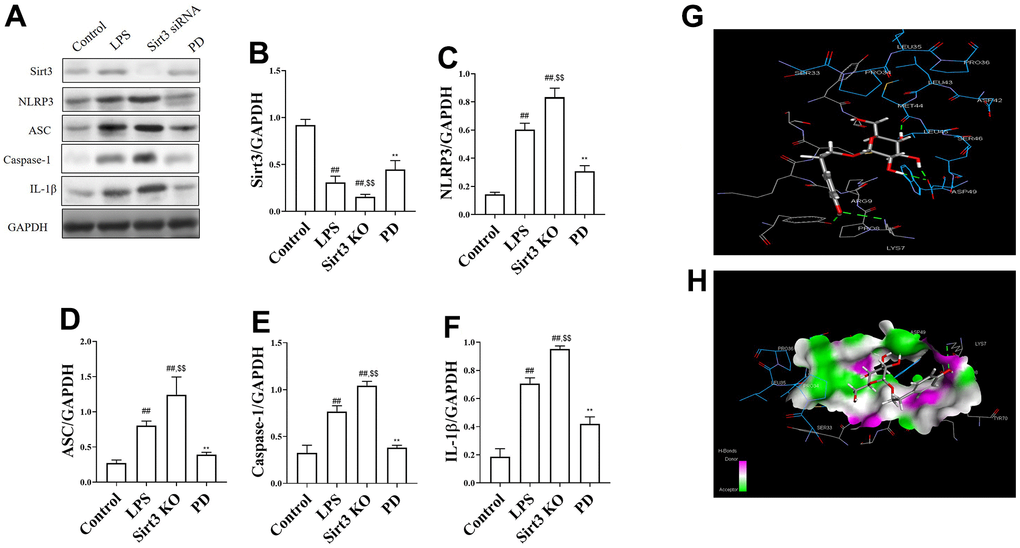
Figure 6.The effects of PD on Sirt3/NLRP3 pathway in LPS-induced MLE-12 cells and molecules docking results of PD and Sirt3. (A–F) The levels of NLRP3, ASC, Caspase-1 and IL-1β; (G, H) molecules docking results of PD and Sirt3. All the data was presented as mean ± SD. Compared with control group: #P<0.05, ##P<0.01. Compared with model group: *P<0.05, **P<0.01.