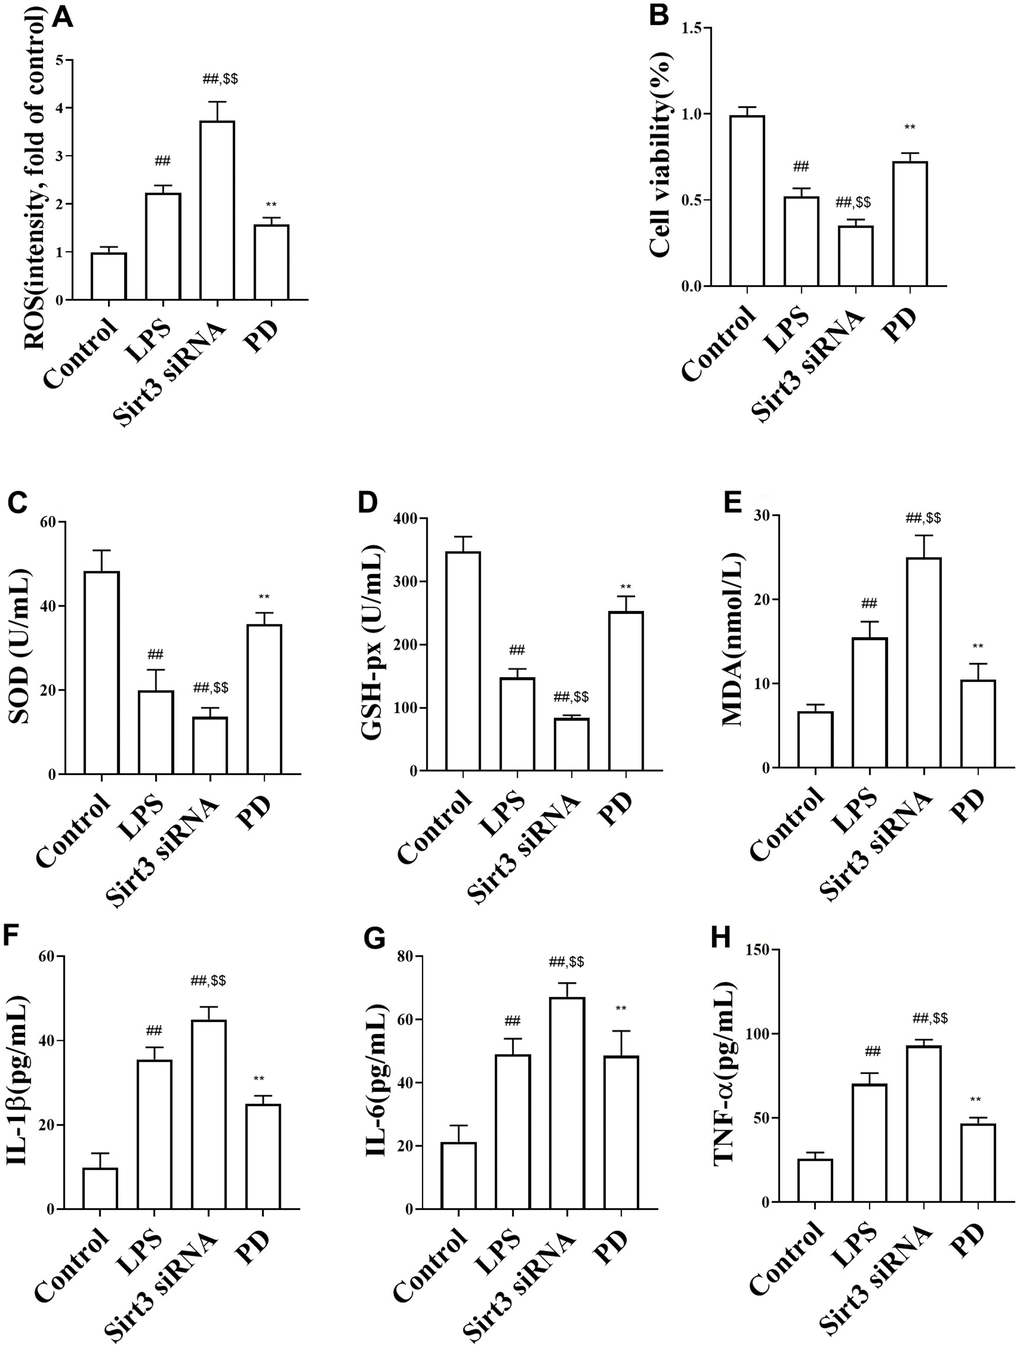
Figure 5.The effects of PD on oxidative stress and cytokine LPS-induced MLE-12 cells. (A, B) ROS and cell viability; (C–E) The level of SOD, MDA, GSH-Px; (F–H) The levels of TNF-a, IL-1β, IL-6. All the data was presented as mean ± SD. Compared with control group: #P<0.05, ##P<0.01. Compared with model group: *P<0.05, **P<0.01.