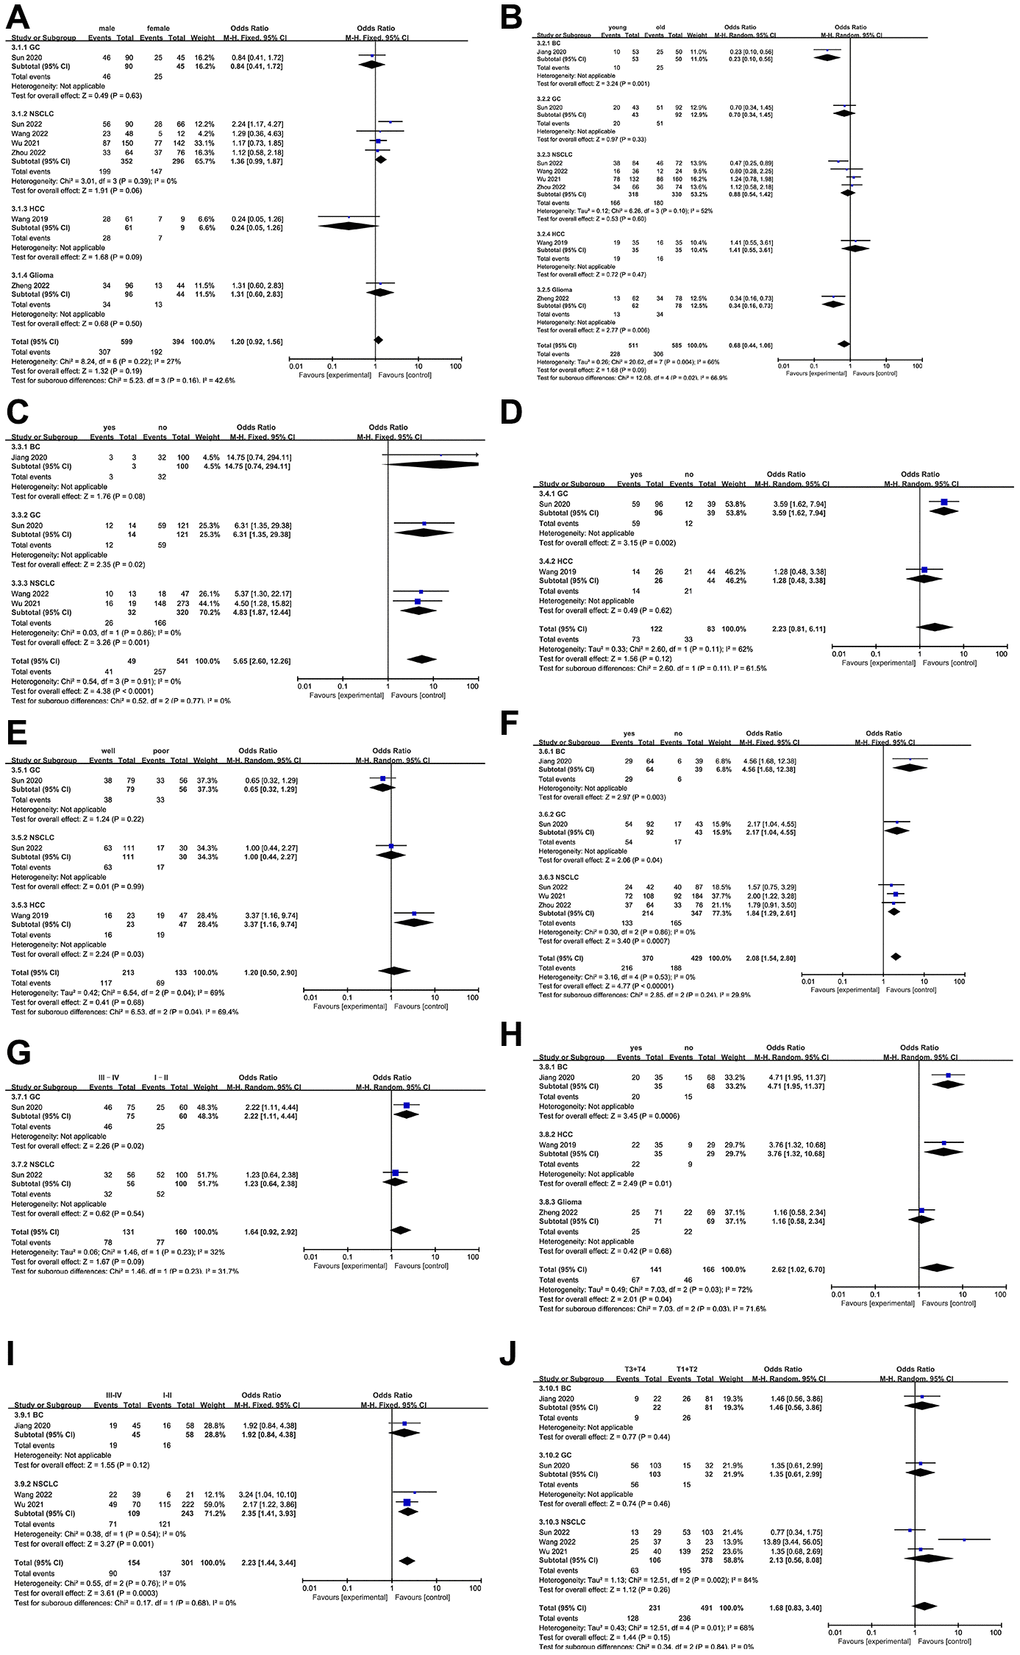
Figure 3.Forest plot of the relationship between high NCAPG expression and clinicopathological parameters. (A) gender, (B) age, (C) distant metastasis, (D) vascular invasion, (E) differentiation, (F) lymph node metastasis, (G) TNM stage, (H) relapse, (I) clinical stage, (J) T classification.