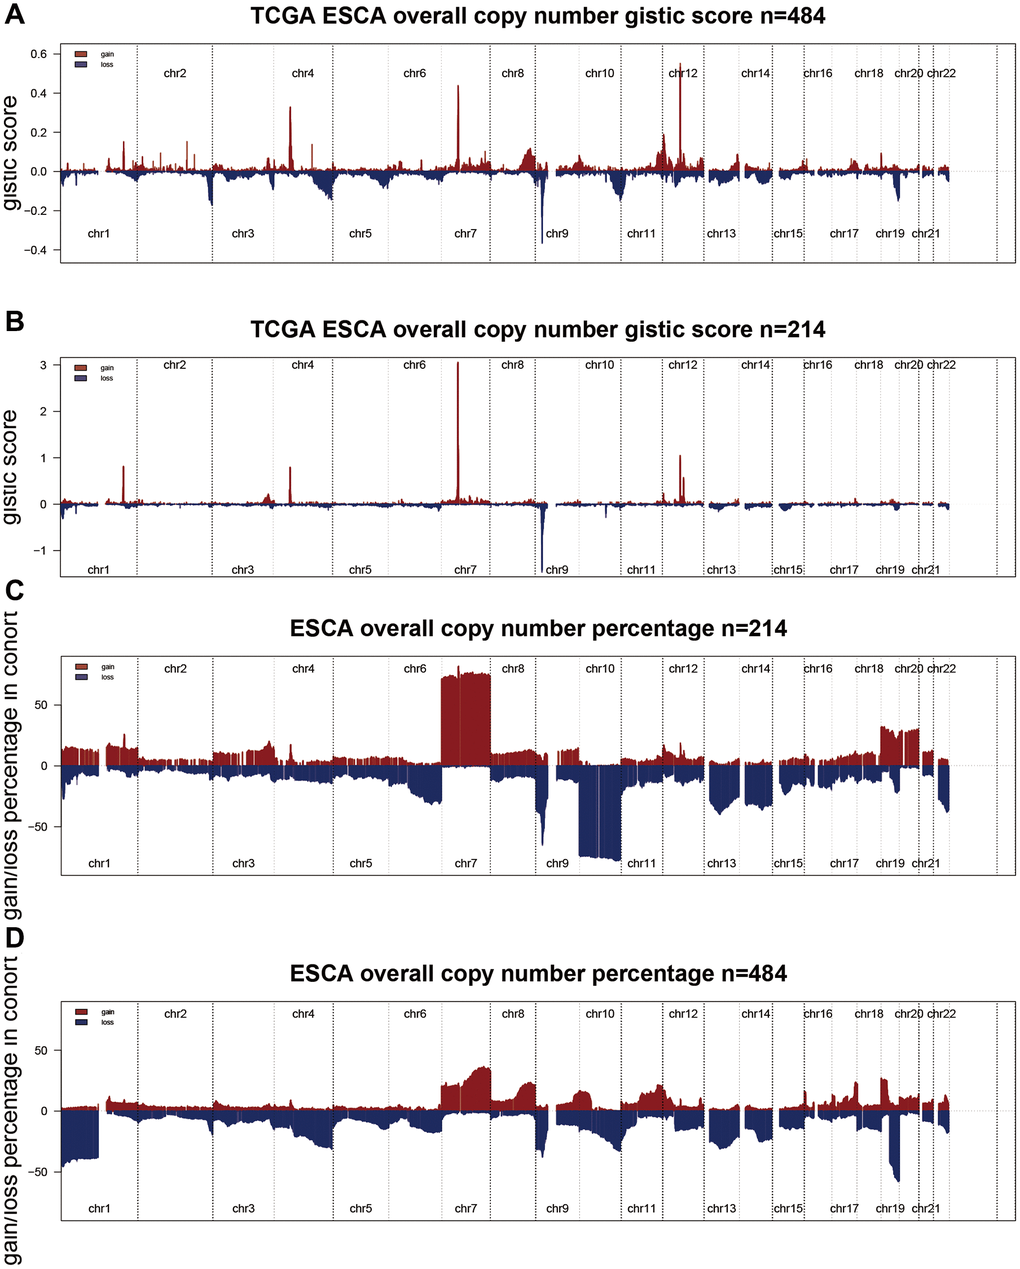
Figure 5.Comprehensive analyses of copy number variation between two cluster groups. (A, B) Detection and comparison of the percentage of significant scores between the two groups. (C, D) Detection and comparison of the percentage of significant gains and losses between the two groups.