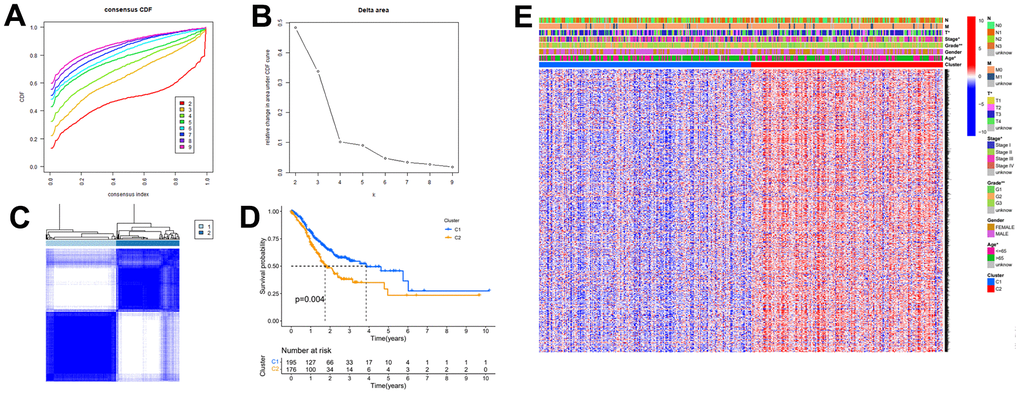
Figure 2.The autophagy -related genes could classify GC into two groups by consensus clustering analysis. (A) Cumulative distribution function (CDF) for k=2 to k=9. (B) Relative change in area under the CDF curve according to different k values. (C) Consensus clustering matrix of samples from TCGA dataset for k=2. (D) Survival analysis of patients in the C1 group and C2 group in TCGA cohort. (E) Heatmap of two clusters defined by the expression of autophagy-related key genes.