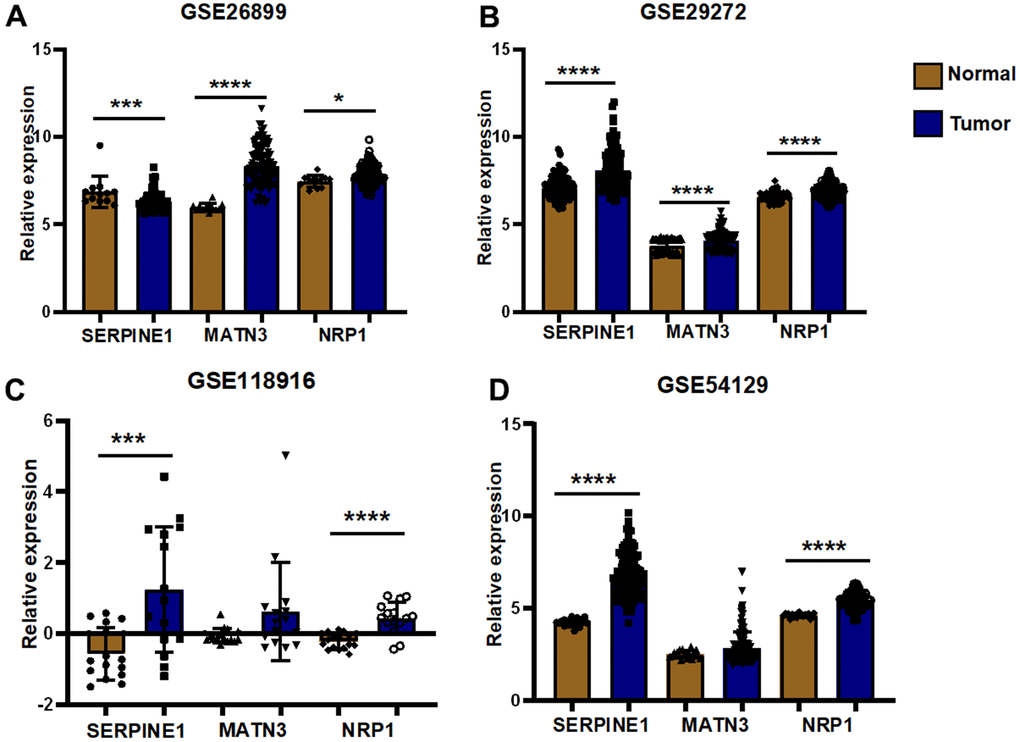
Figure 10.External validation of GEO datasets. (A) Differential expression analysis was performed in GSE26899 (B) Differential expression analysis was performed in GSE29272 (C) Differential expression analysis was performed in GSE118916 (D) Differential expression analysis was performed in GSE54129(*P< 0.05; **P< 0.01; ***P< 0.001;****P< 0.0001).